Exploring the Effects of Scale in Augmented Reality-Empowered Visual Analytics
We study how users perform logical reasoning tasks on visualizations displayed in two different scales commonly employed in our everyday lives (the size of a room versus the size of a table) in an Augmented Reality (AR) environment.
Emerging Augmented Reality (AR) technologies can enable situated interactive visual analytics beyond the screen. However, the presentation and interaction design of data visualization integrated into the physical environment may vary in different scales. Understanding how users manage their spatial relationships with AR visualization under different representational scales is crucial for designing userfriendly AR-empowered visual analytic systems. To this end, we present a study with 16 participants, inviting them to solve two logical reasoning puzzles by interacting with the associated node-link graphs in AR in room- and tablescales respectively. Through observation, interviews, and video analysis, we identify three types of spatial arrangements, which are, positioning the visualization in the figural, vista, or panoramic space of a user. We further explore how scales and visualization design affect users’ spatial preferences and exploratory behaviors, and summarize our findings among the three types of spatial arrangements.
Scales in AR
Room-scale of the laboratory scene
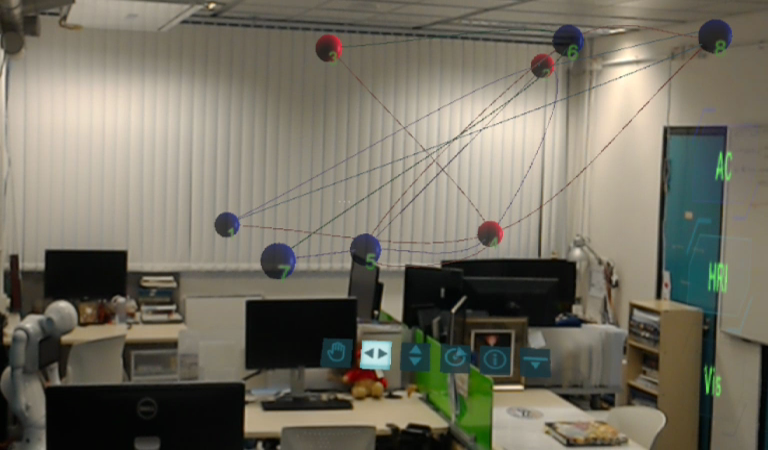
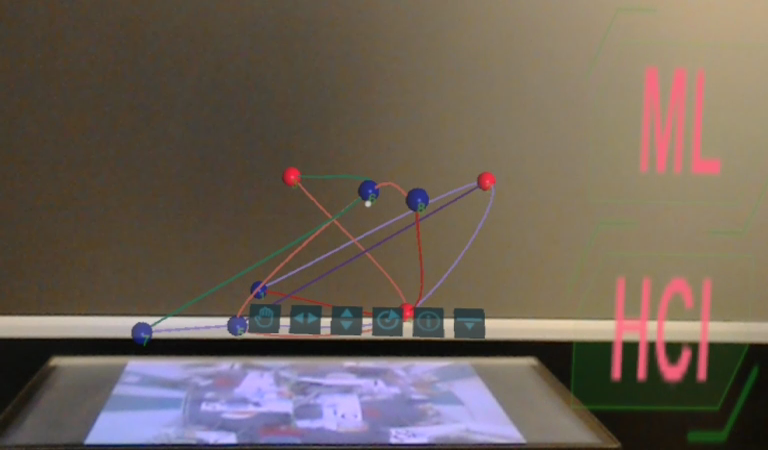
Table-scale of the laboratory scene
Room-scale of the office scene
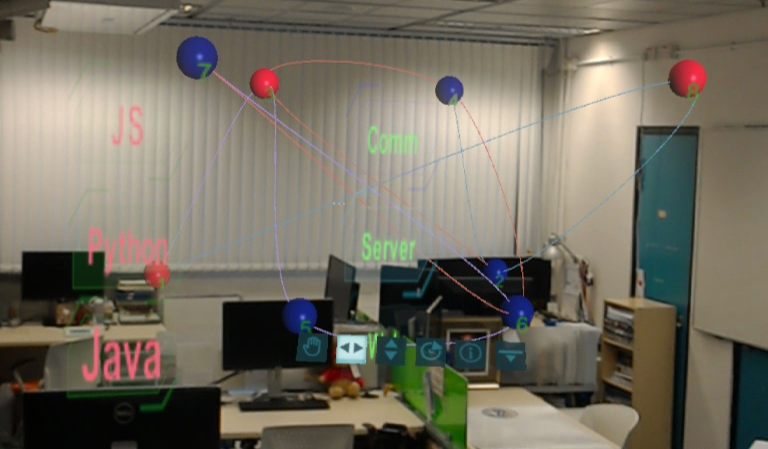
Table-scale of the office scene
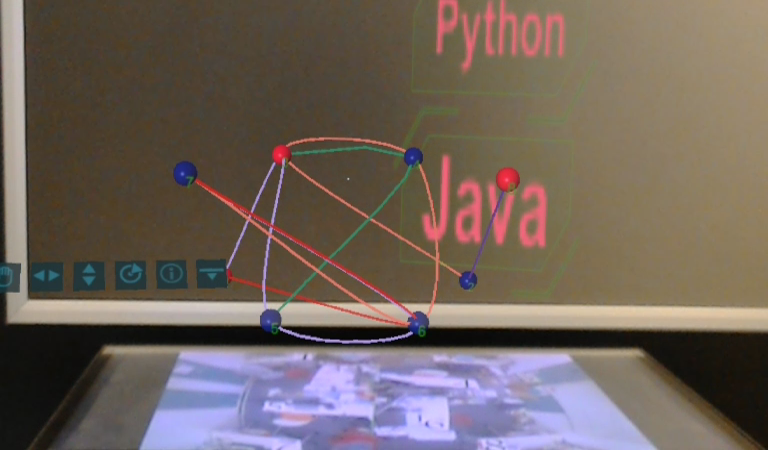
Real-time screenshots of the virtual visualization model augmented on physical objects during exploration in the AR context, captured through Microsoft HoloLens. (a) is the room-scale of the laboratory scene; (b) is the room-scale of the office scene; (c) is the table-scale of the laboratory scene; (d) is the table-scale of the office scene.
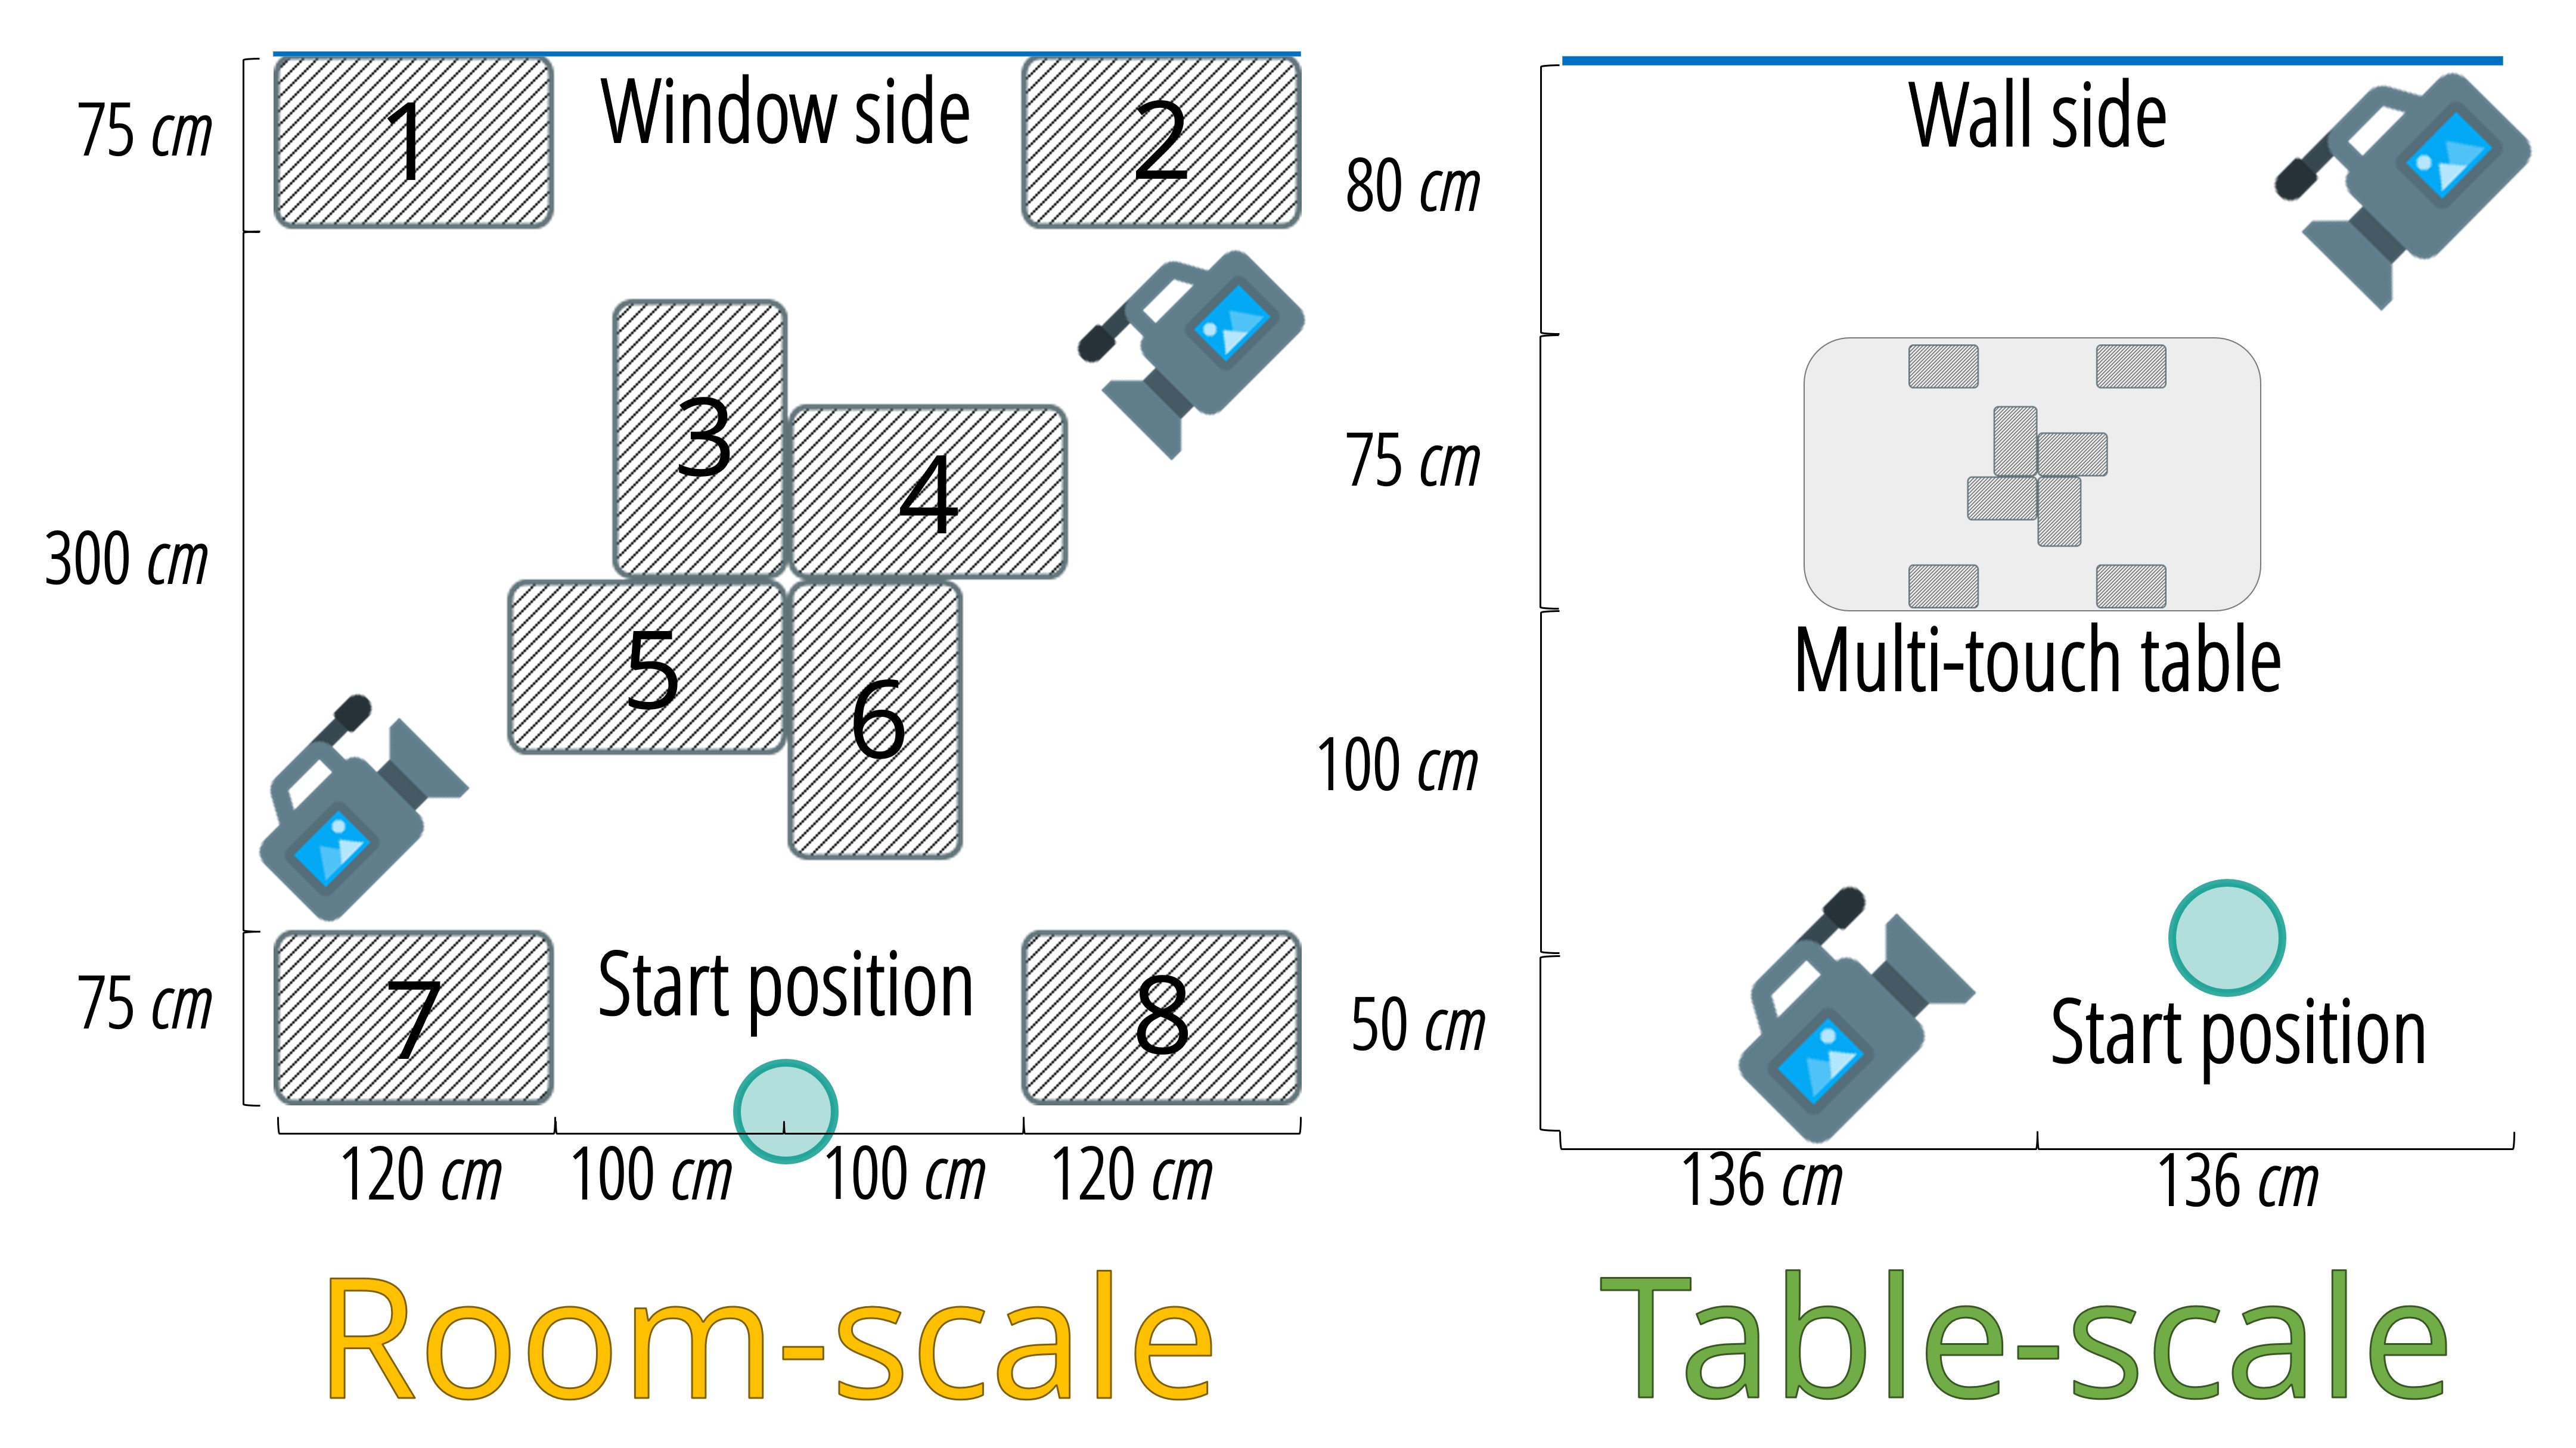
Seating arrangement and experimental setup: (a) room-scale and (b) table-scale.
Users’ Spatial Preferences and Exploratory Behaviors


The schematic diagram for spatial relationships identified through video coding. These four diagrams show the participants explored the virtual visualization model in (a) figurative; (b) vista; (c) panoramic; (d) mixed space separately.
User Behavior Analysis
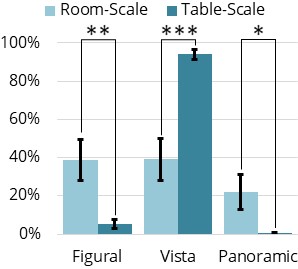
Percentage (with standard error) of time spent in each spatial arrangement based on video coding. ***: p <= 0.001; **: p < 0.05; *: 0.05 <= p < 0.1.
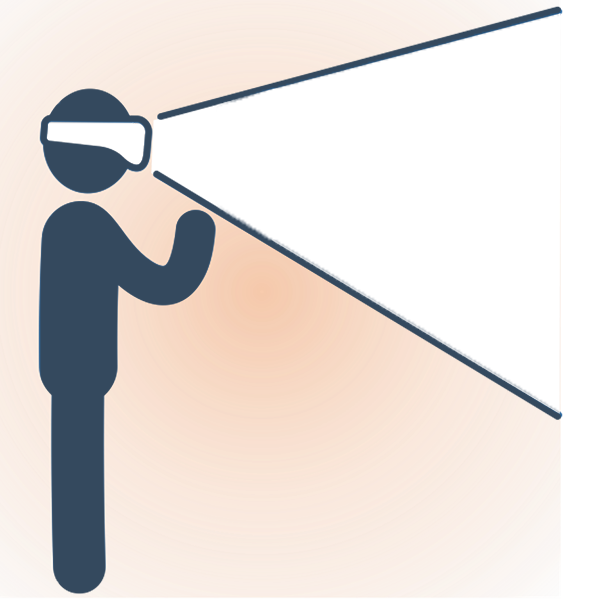
Figurative space
Panoramic space
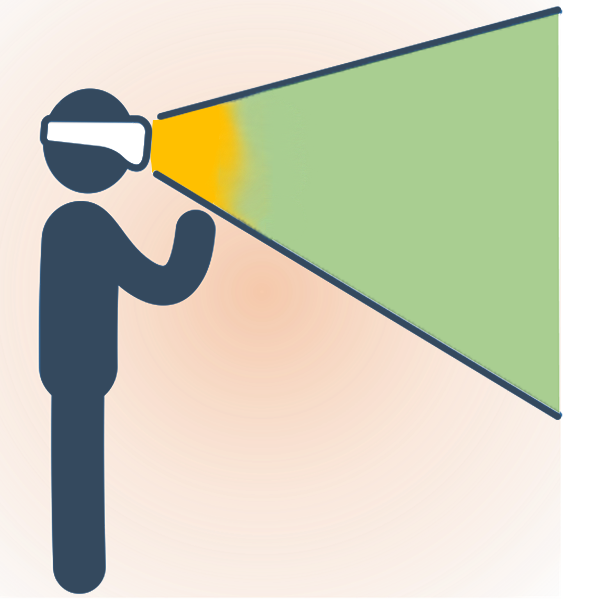
Vista space
Mixed space
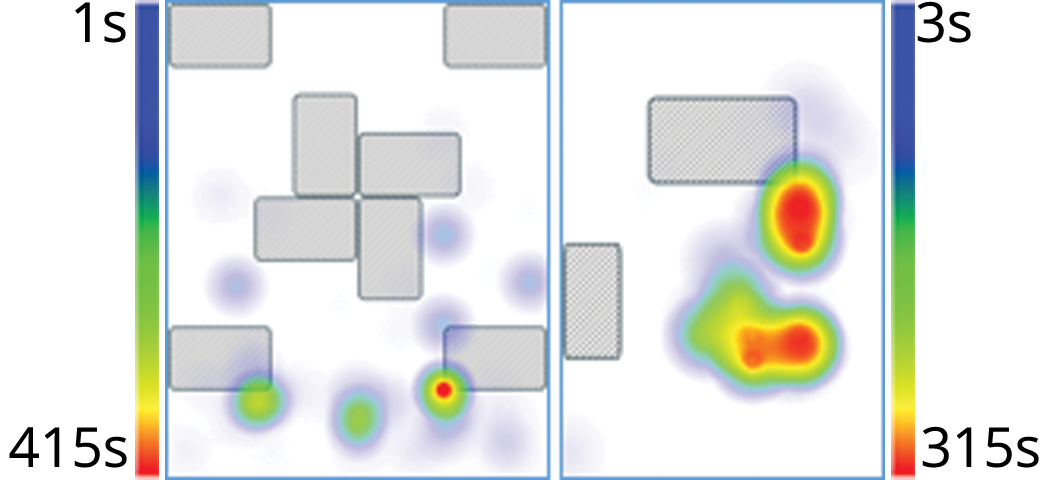
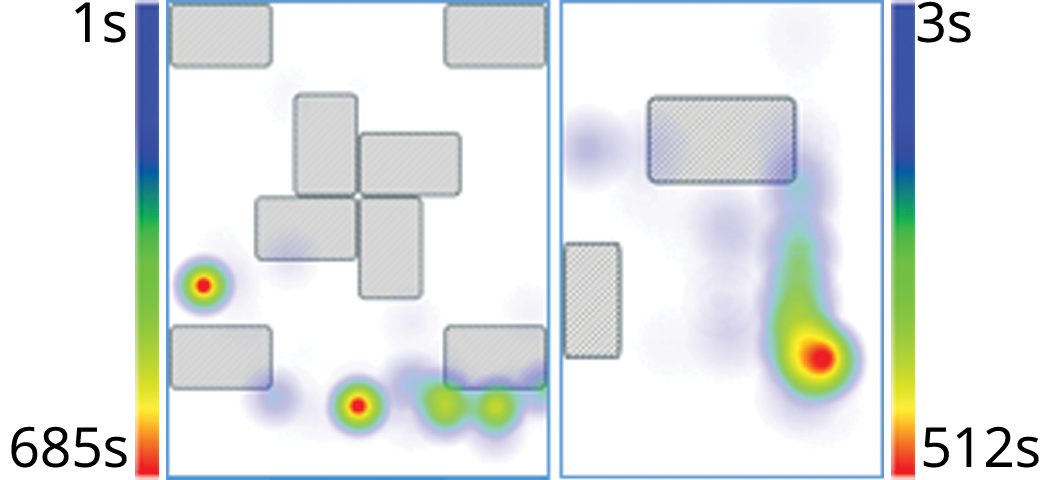
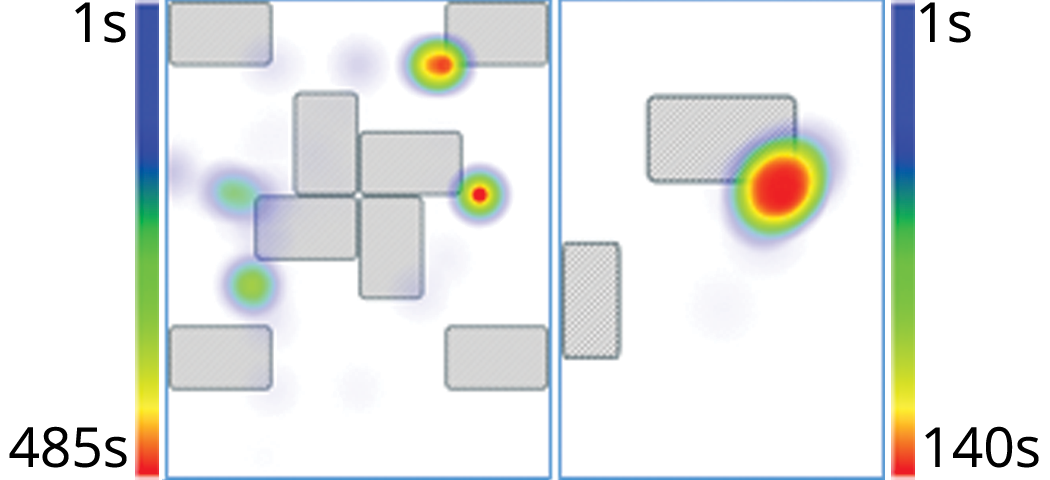
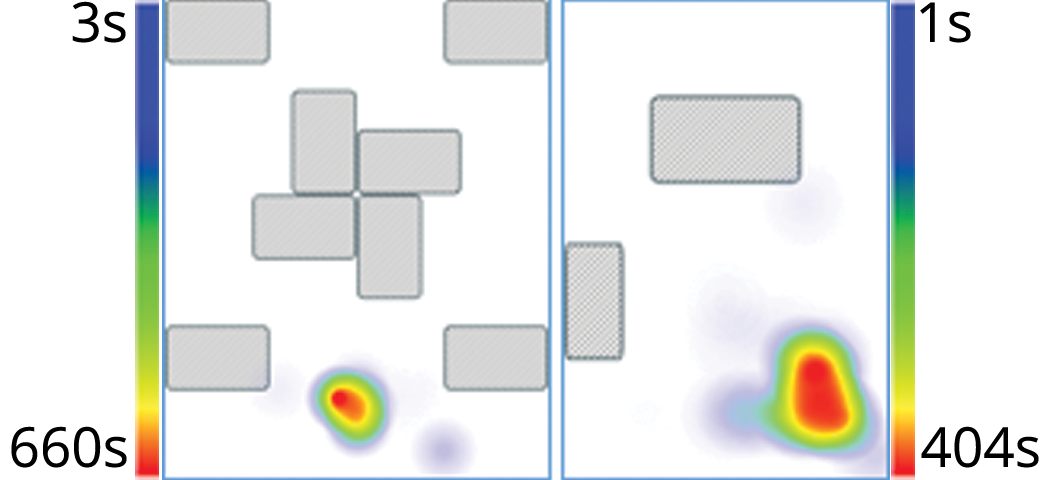
Heatmap of the duration spent in the room-scale (left on each figure) and table-scale (right on each figure) based on participants’ movement trajectories captured in video recordings. Plots are arranged by the primary spatial relationship adopted, i.e., (a) figurative space; (b) vista space; (c) panoramic space; (d) mixed space.
Zhida Sun, Feng Han, and Xiaojuan Ma. 2018. Exploring the Effects of Scale in Augmented Reality-Empowered Visual Analytics. In Extended Abstracts of the 2018 CHI Conference on Human Factors in Computing Systems (CHI EA '18). ACM, New York, NY, USA, Paper LBW012, 6 pages. DOI: https://doi.org/10.1145/3170427.3188551