Attention, Comprehension, Execution: Effects of Different Designs of Biofeedback Display
We explore four different designs, i.e., graphical, illustrative, artistic, and ambient representations, by visualizing physiological data in the individual setting.
The rapid development of biosensors and wearable devices has led to an increasing number of Quantified Self applications with physiological data. However, conventional graph-style visual representations which have been commonly used for behavior monitoring and control may not be the most applicable biofeedback methods. This is because biosensor data is not intuitive and is hard to manipulate directly and precisely, especially in computer-mediated collaborative interactions. In this work, we explore four different designs, i.e., graphical, illustrative, artistic and ambient representations, by visualizing physiological data in individual settings. Following the Research through Design model, we compare these four designs regarding their abilities to facilitate biofeedback interpretation through a within-subject controlled experiment with 24 participants. The results suggest that users’ visual perception is affected by different design styles.
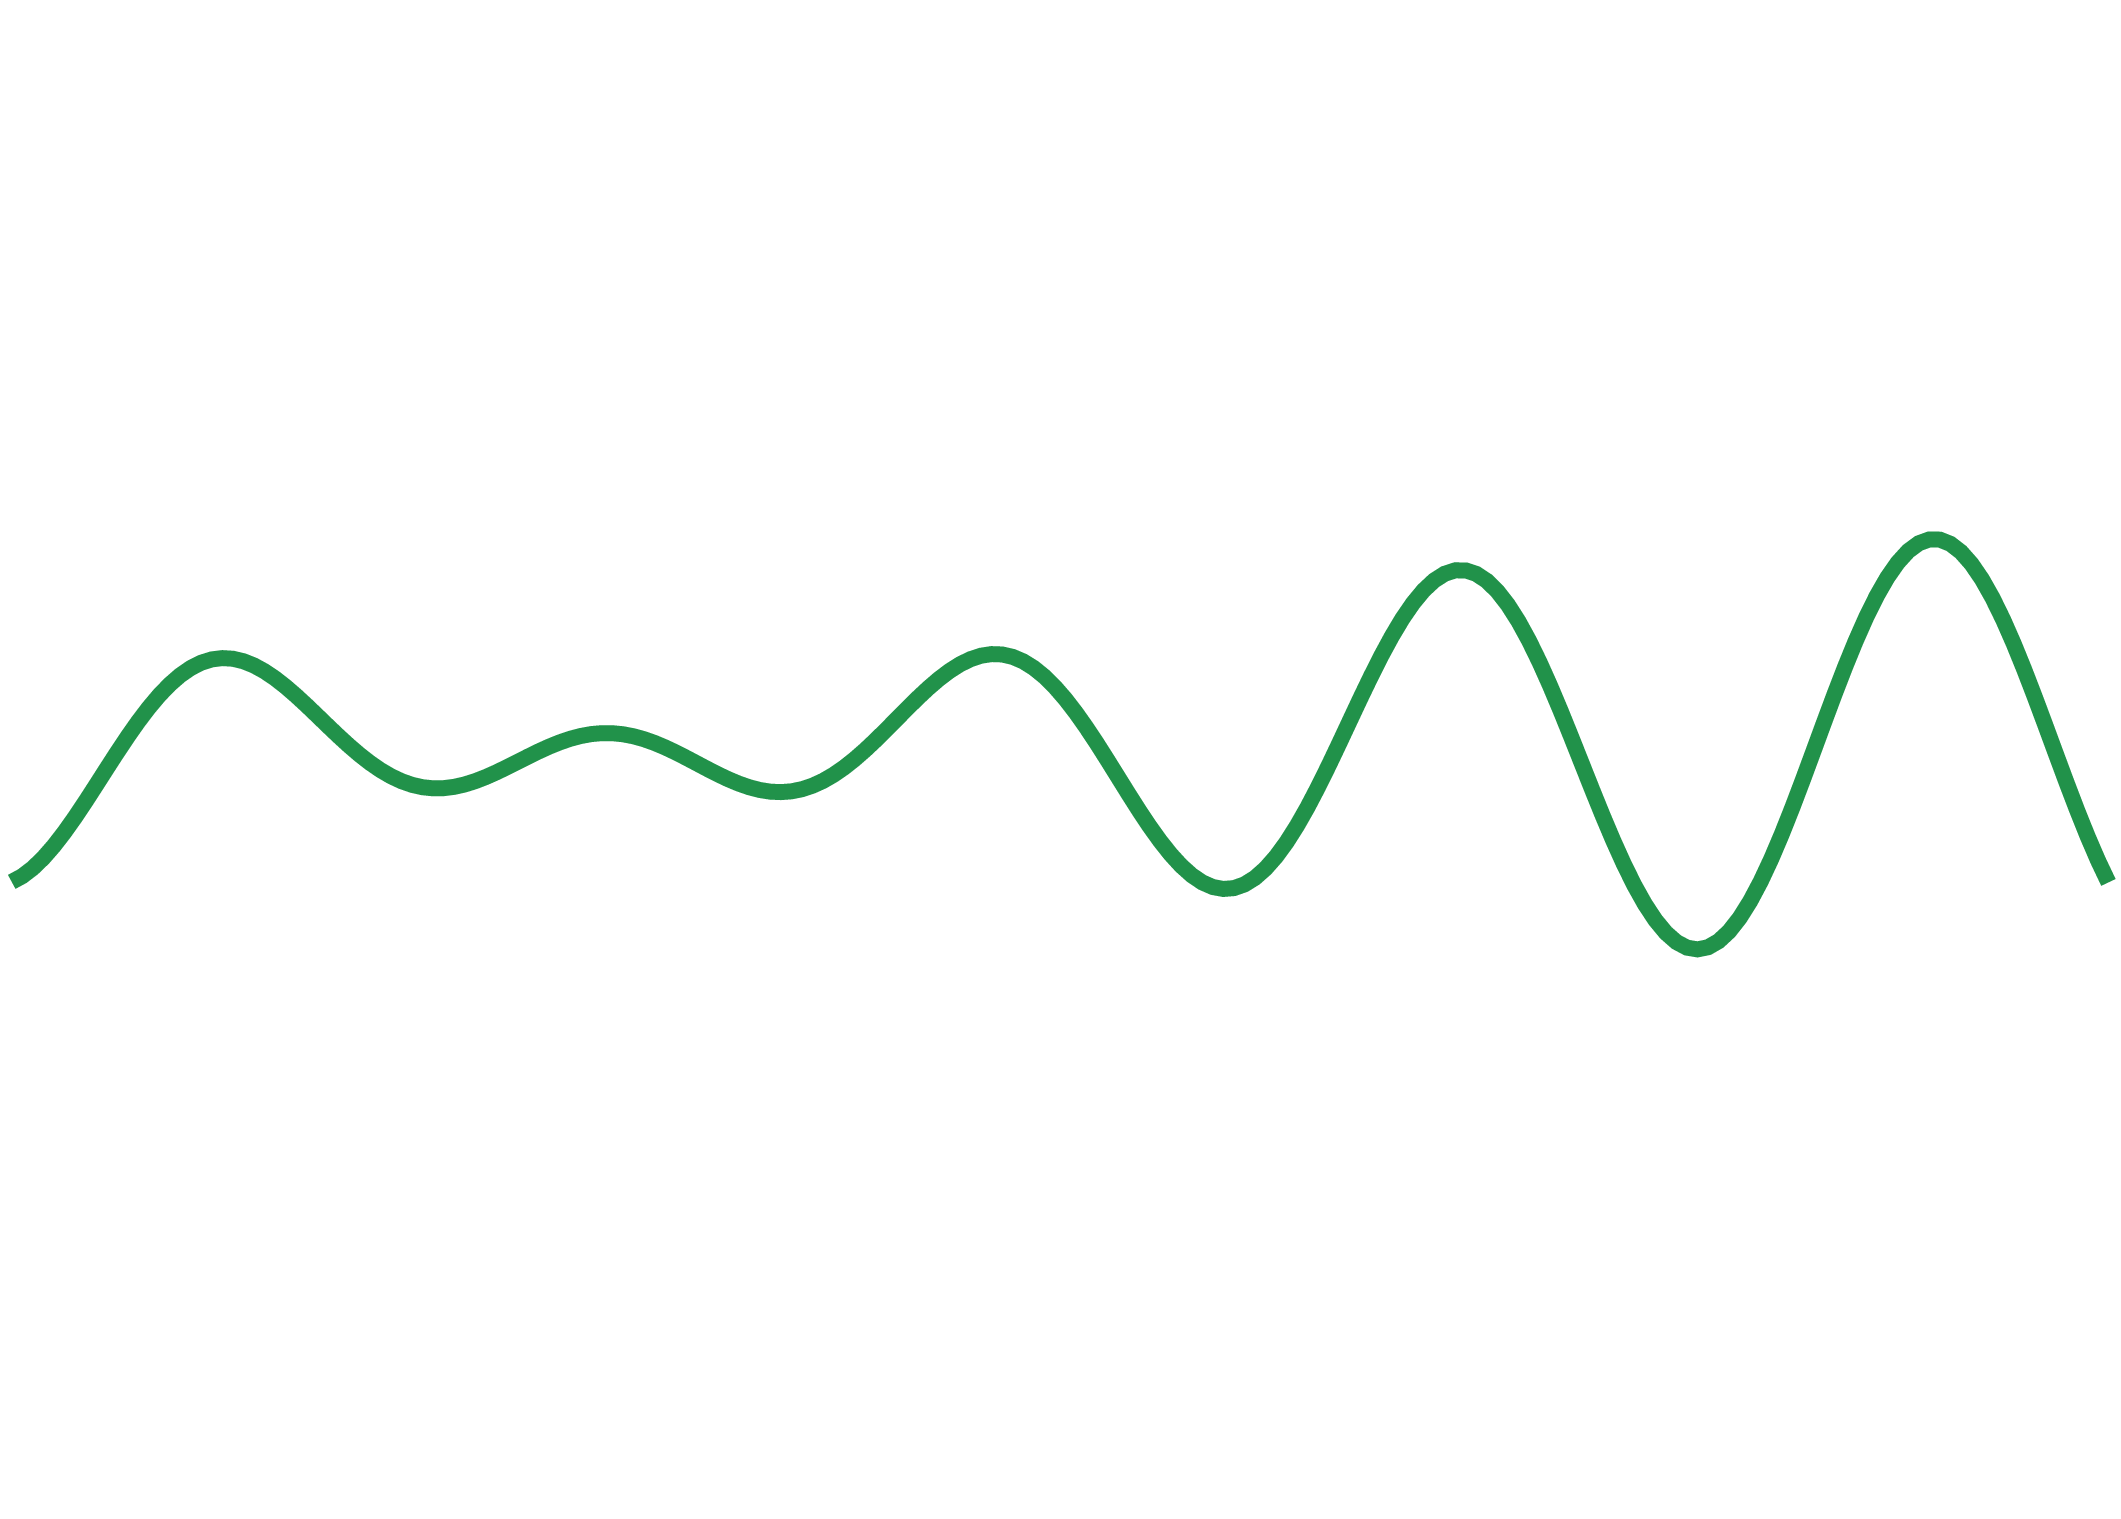
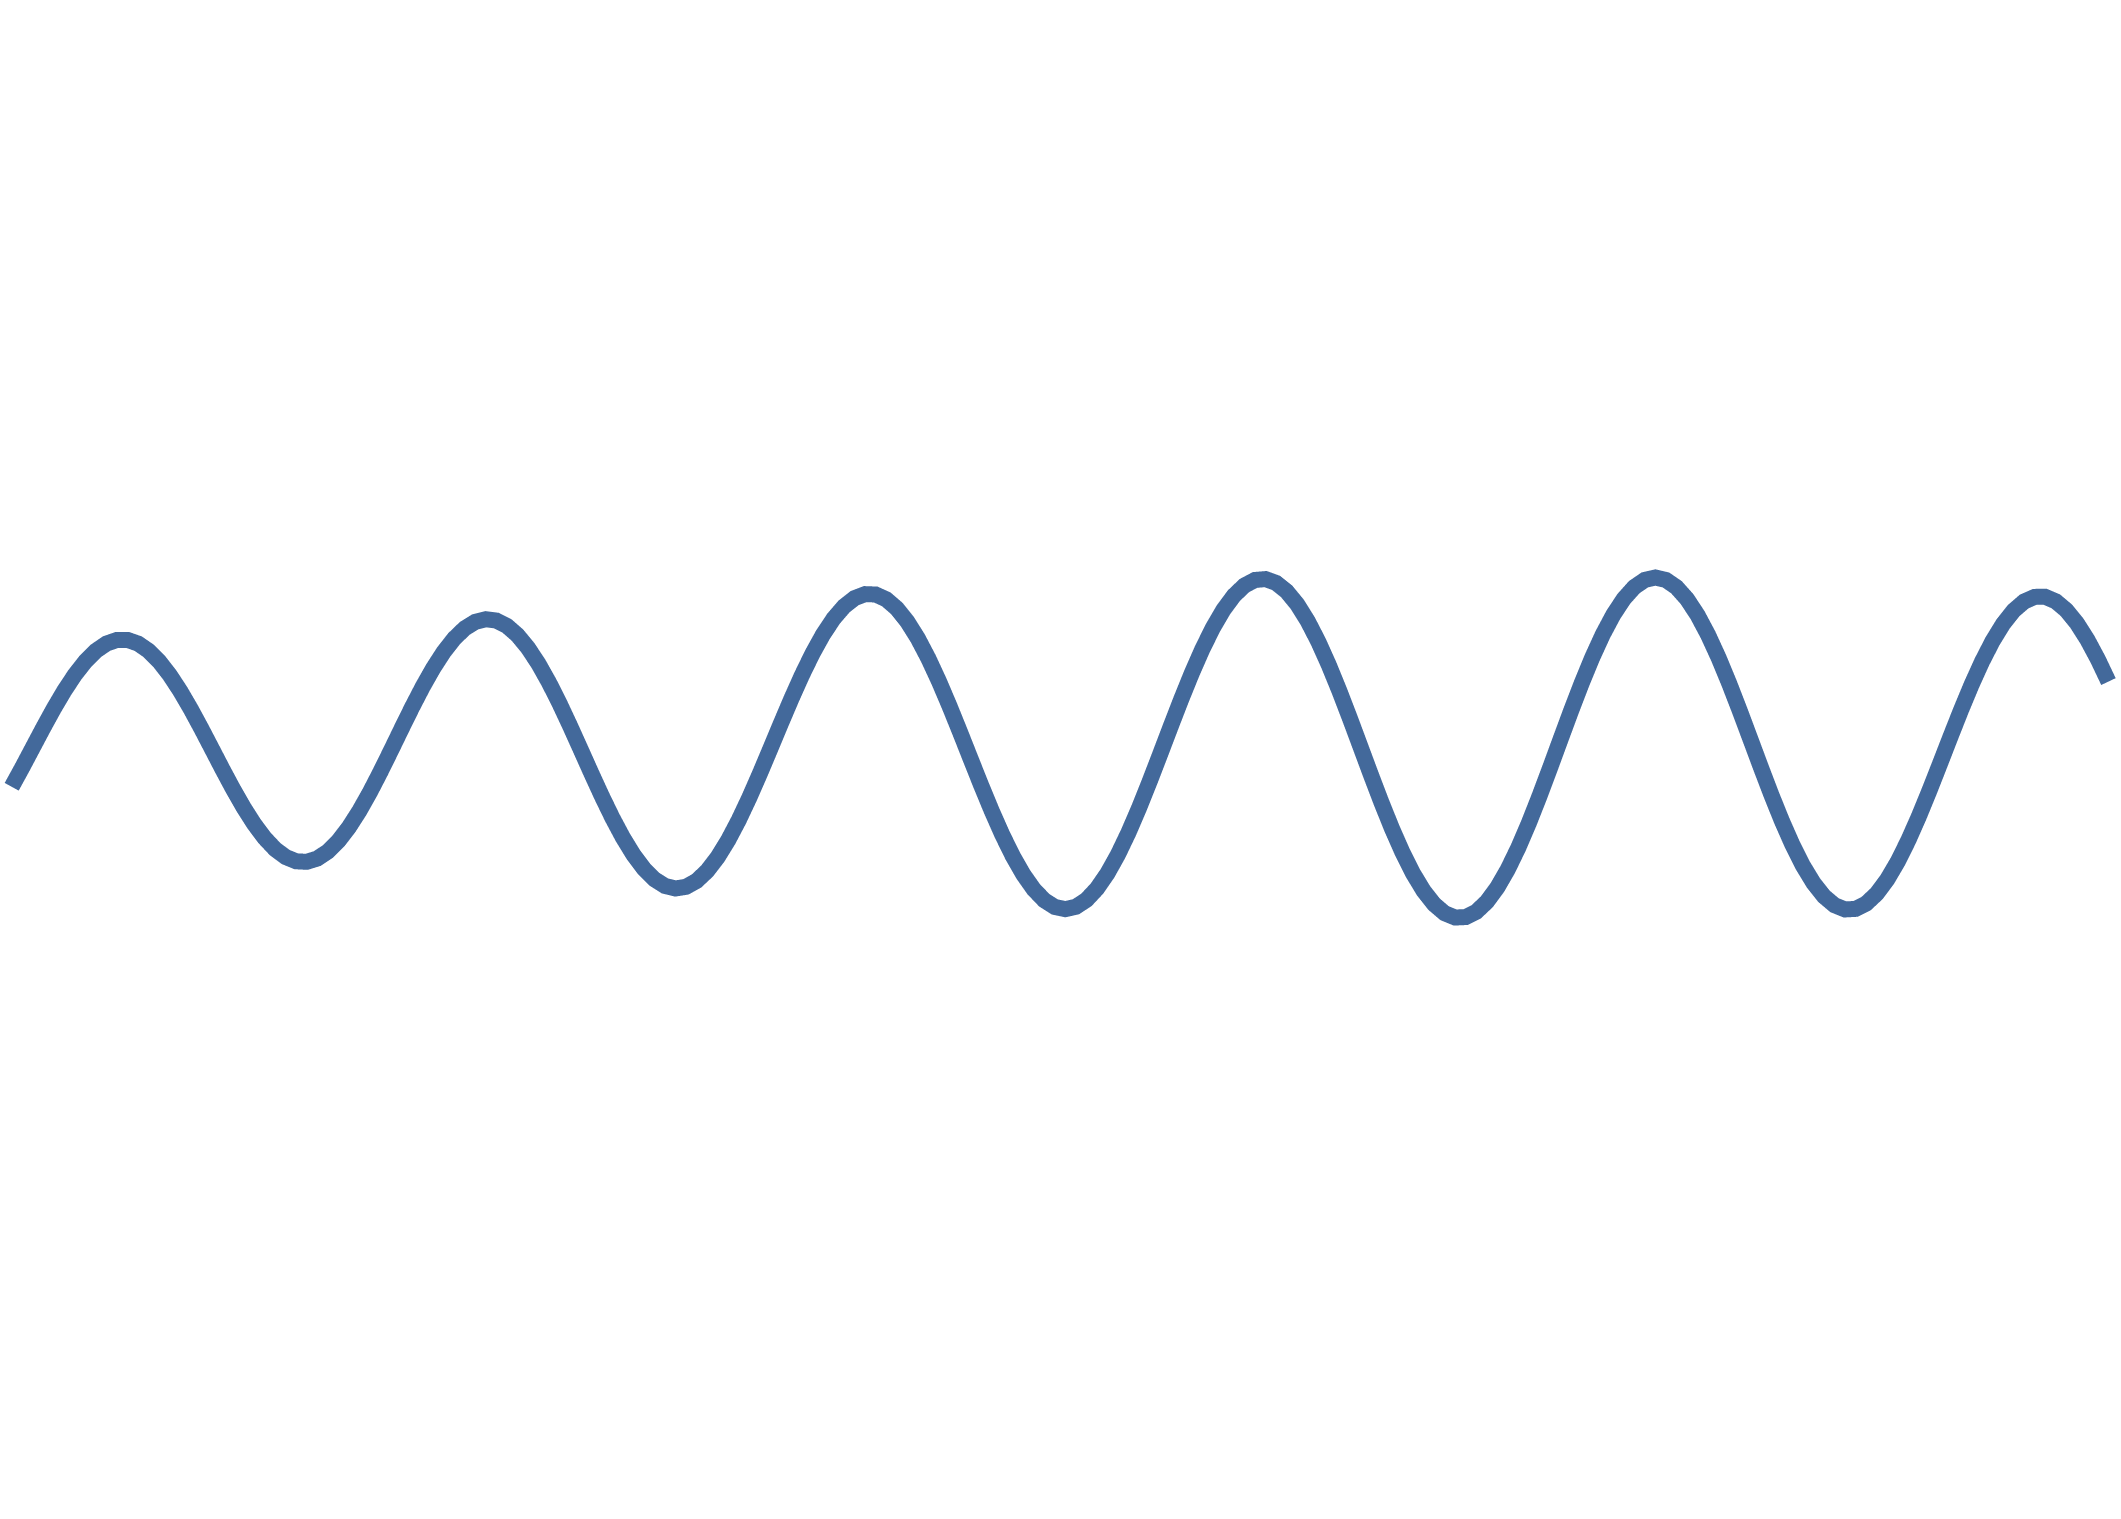
Example of Representation Styles
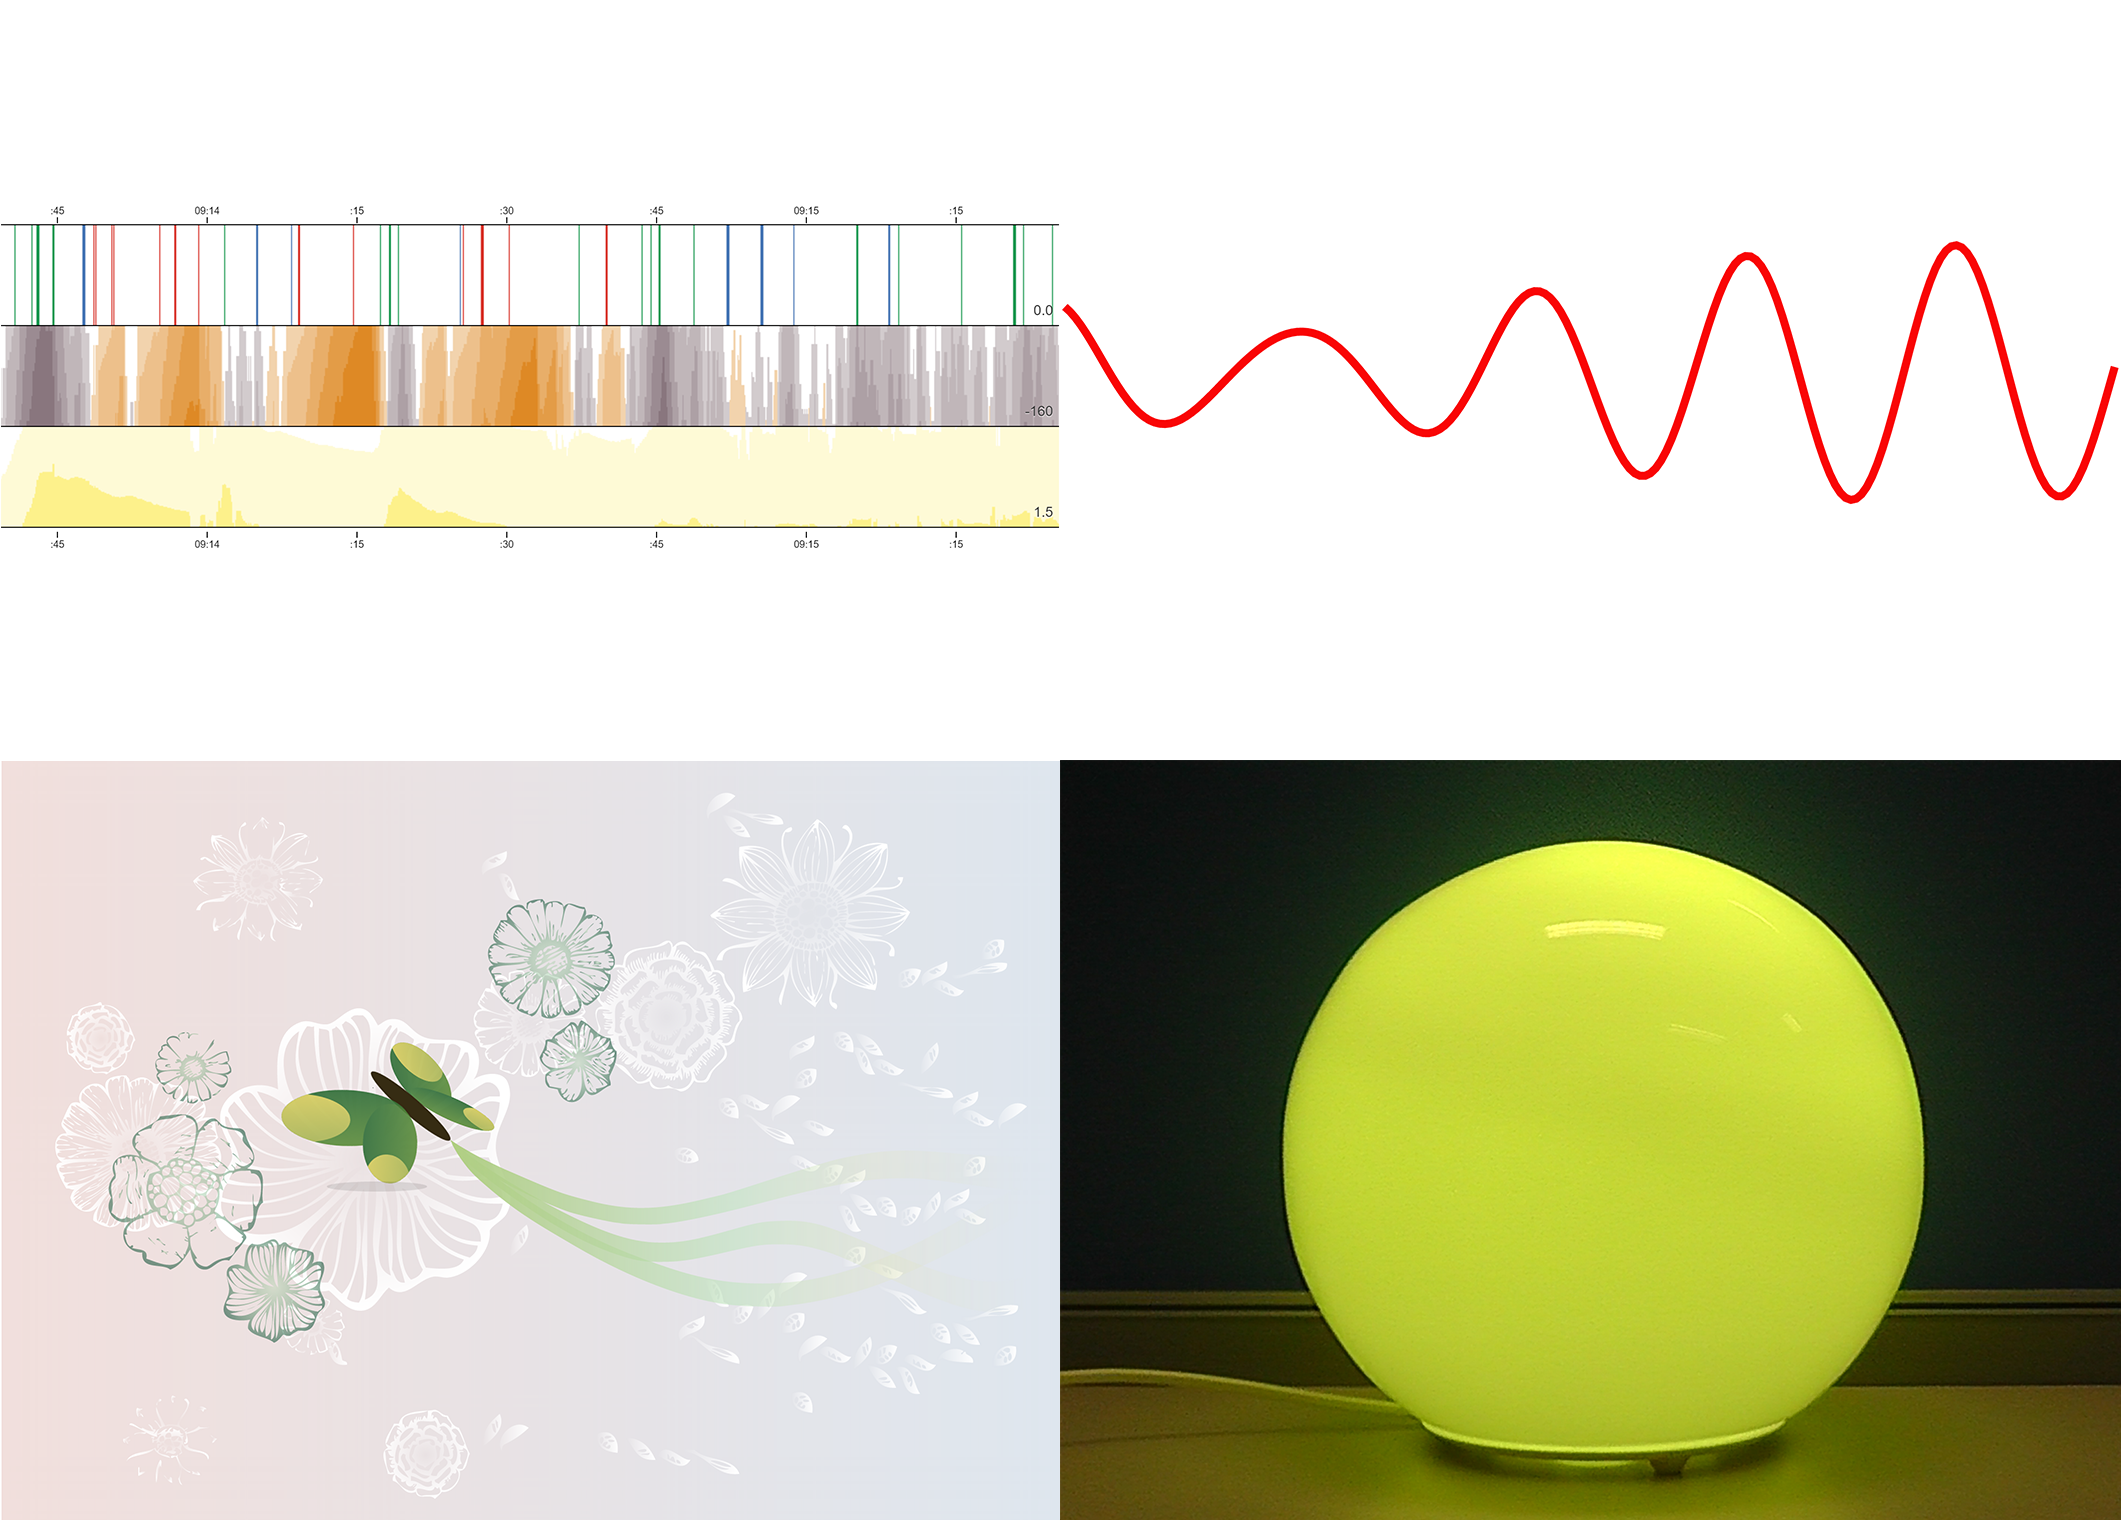
Visual designs of four different representations in individual context based on biofeedback data: (1) graphical (top-left), (2) illustrative (top-right), (3) artistic (bottom-left), and (4) ambient (bottom-right), respectively.
Terms and Design Details
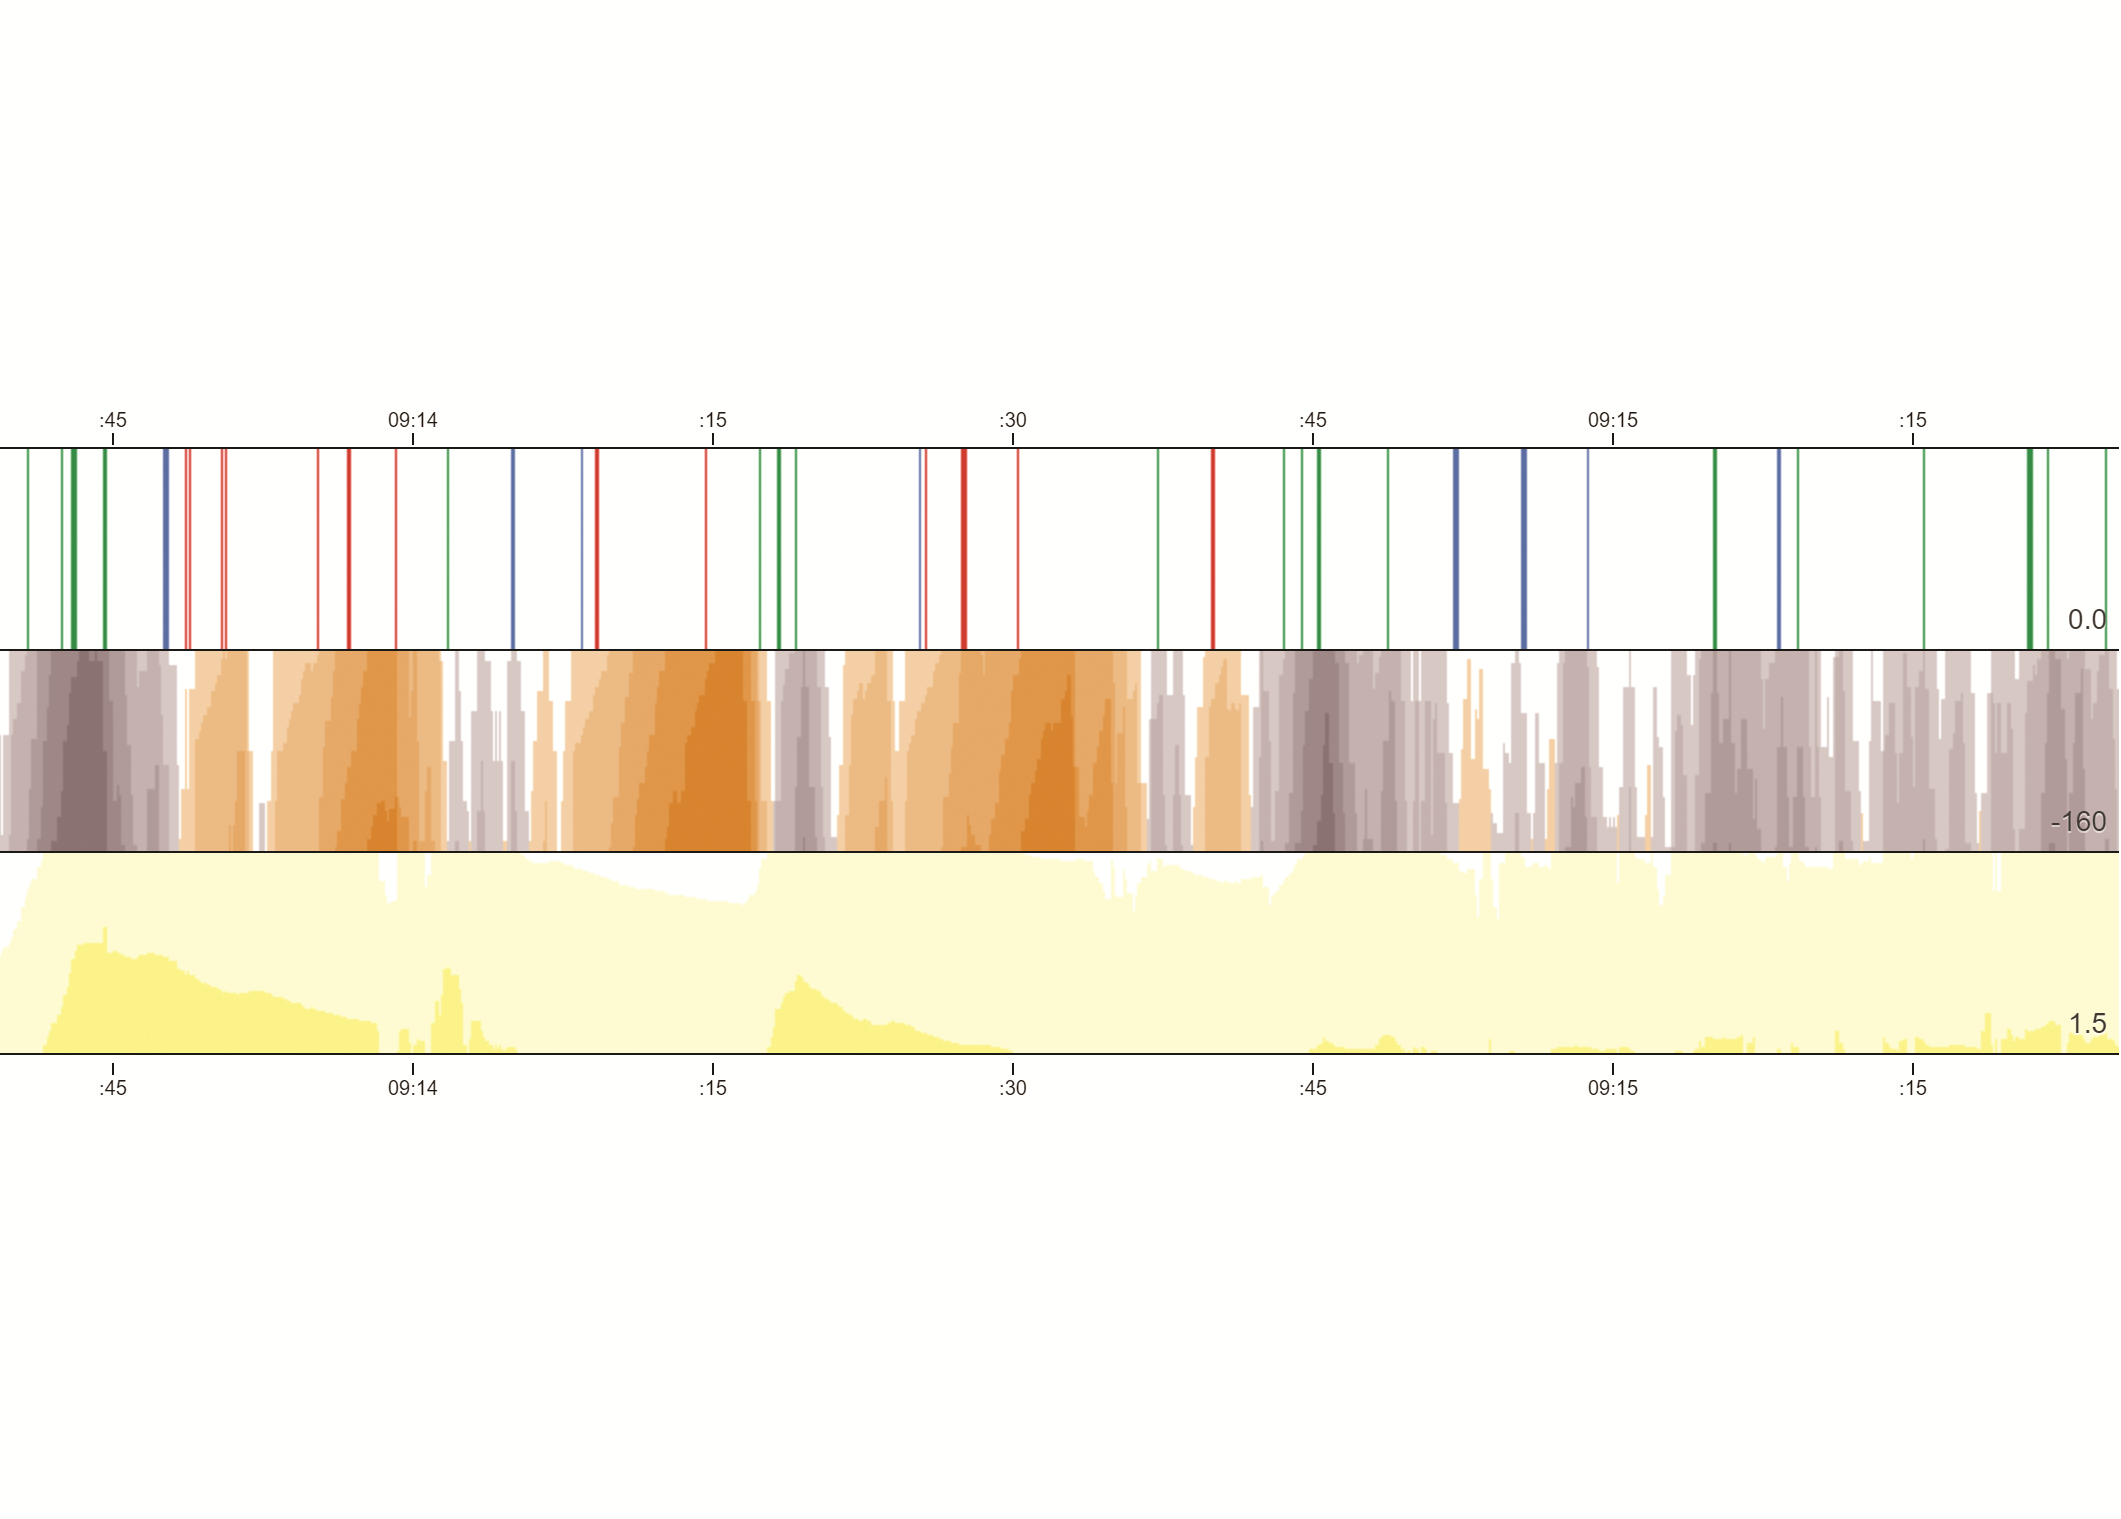
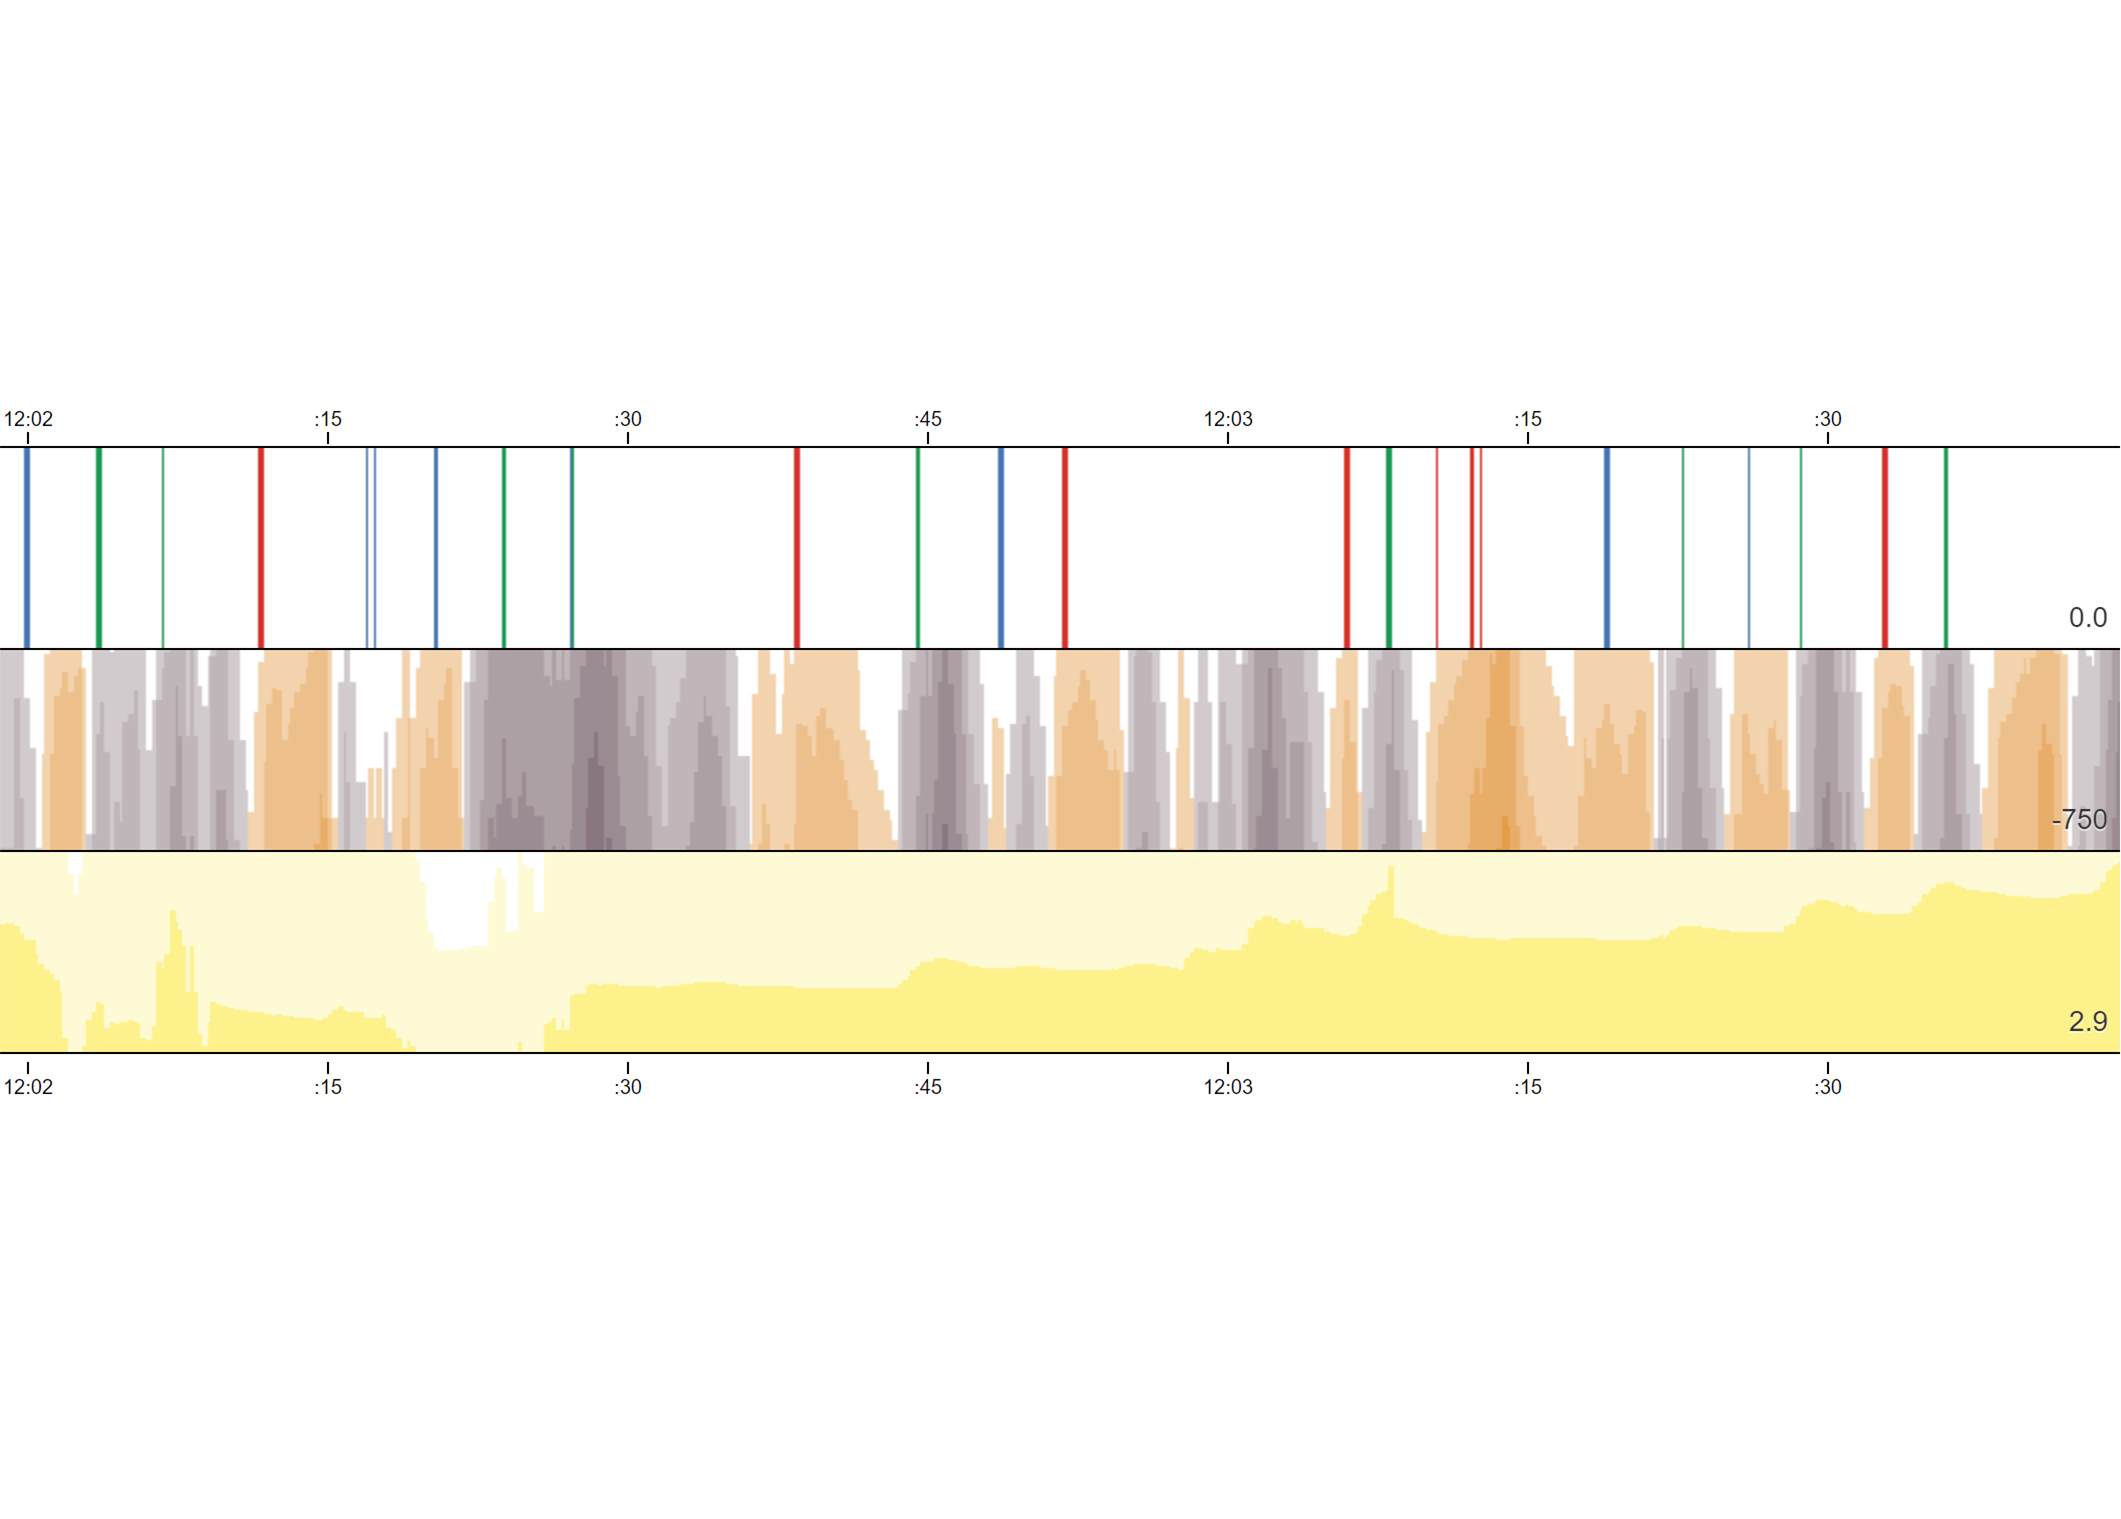
Graphical representation refers to visualization designs showing the raw data or the statistical summary derived from the raw data intuitively. They are the overview as well as detailed descriptions to the raw data.
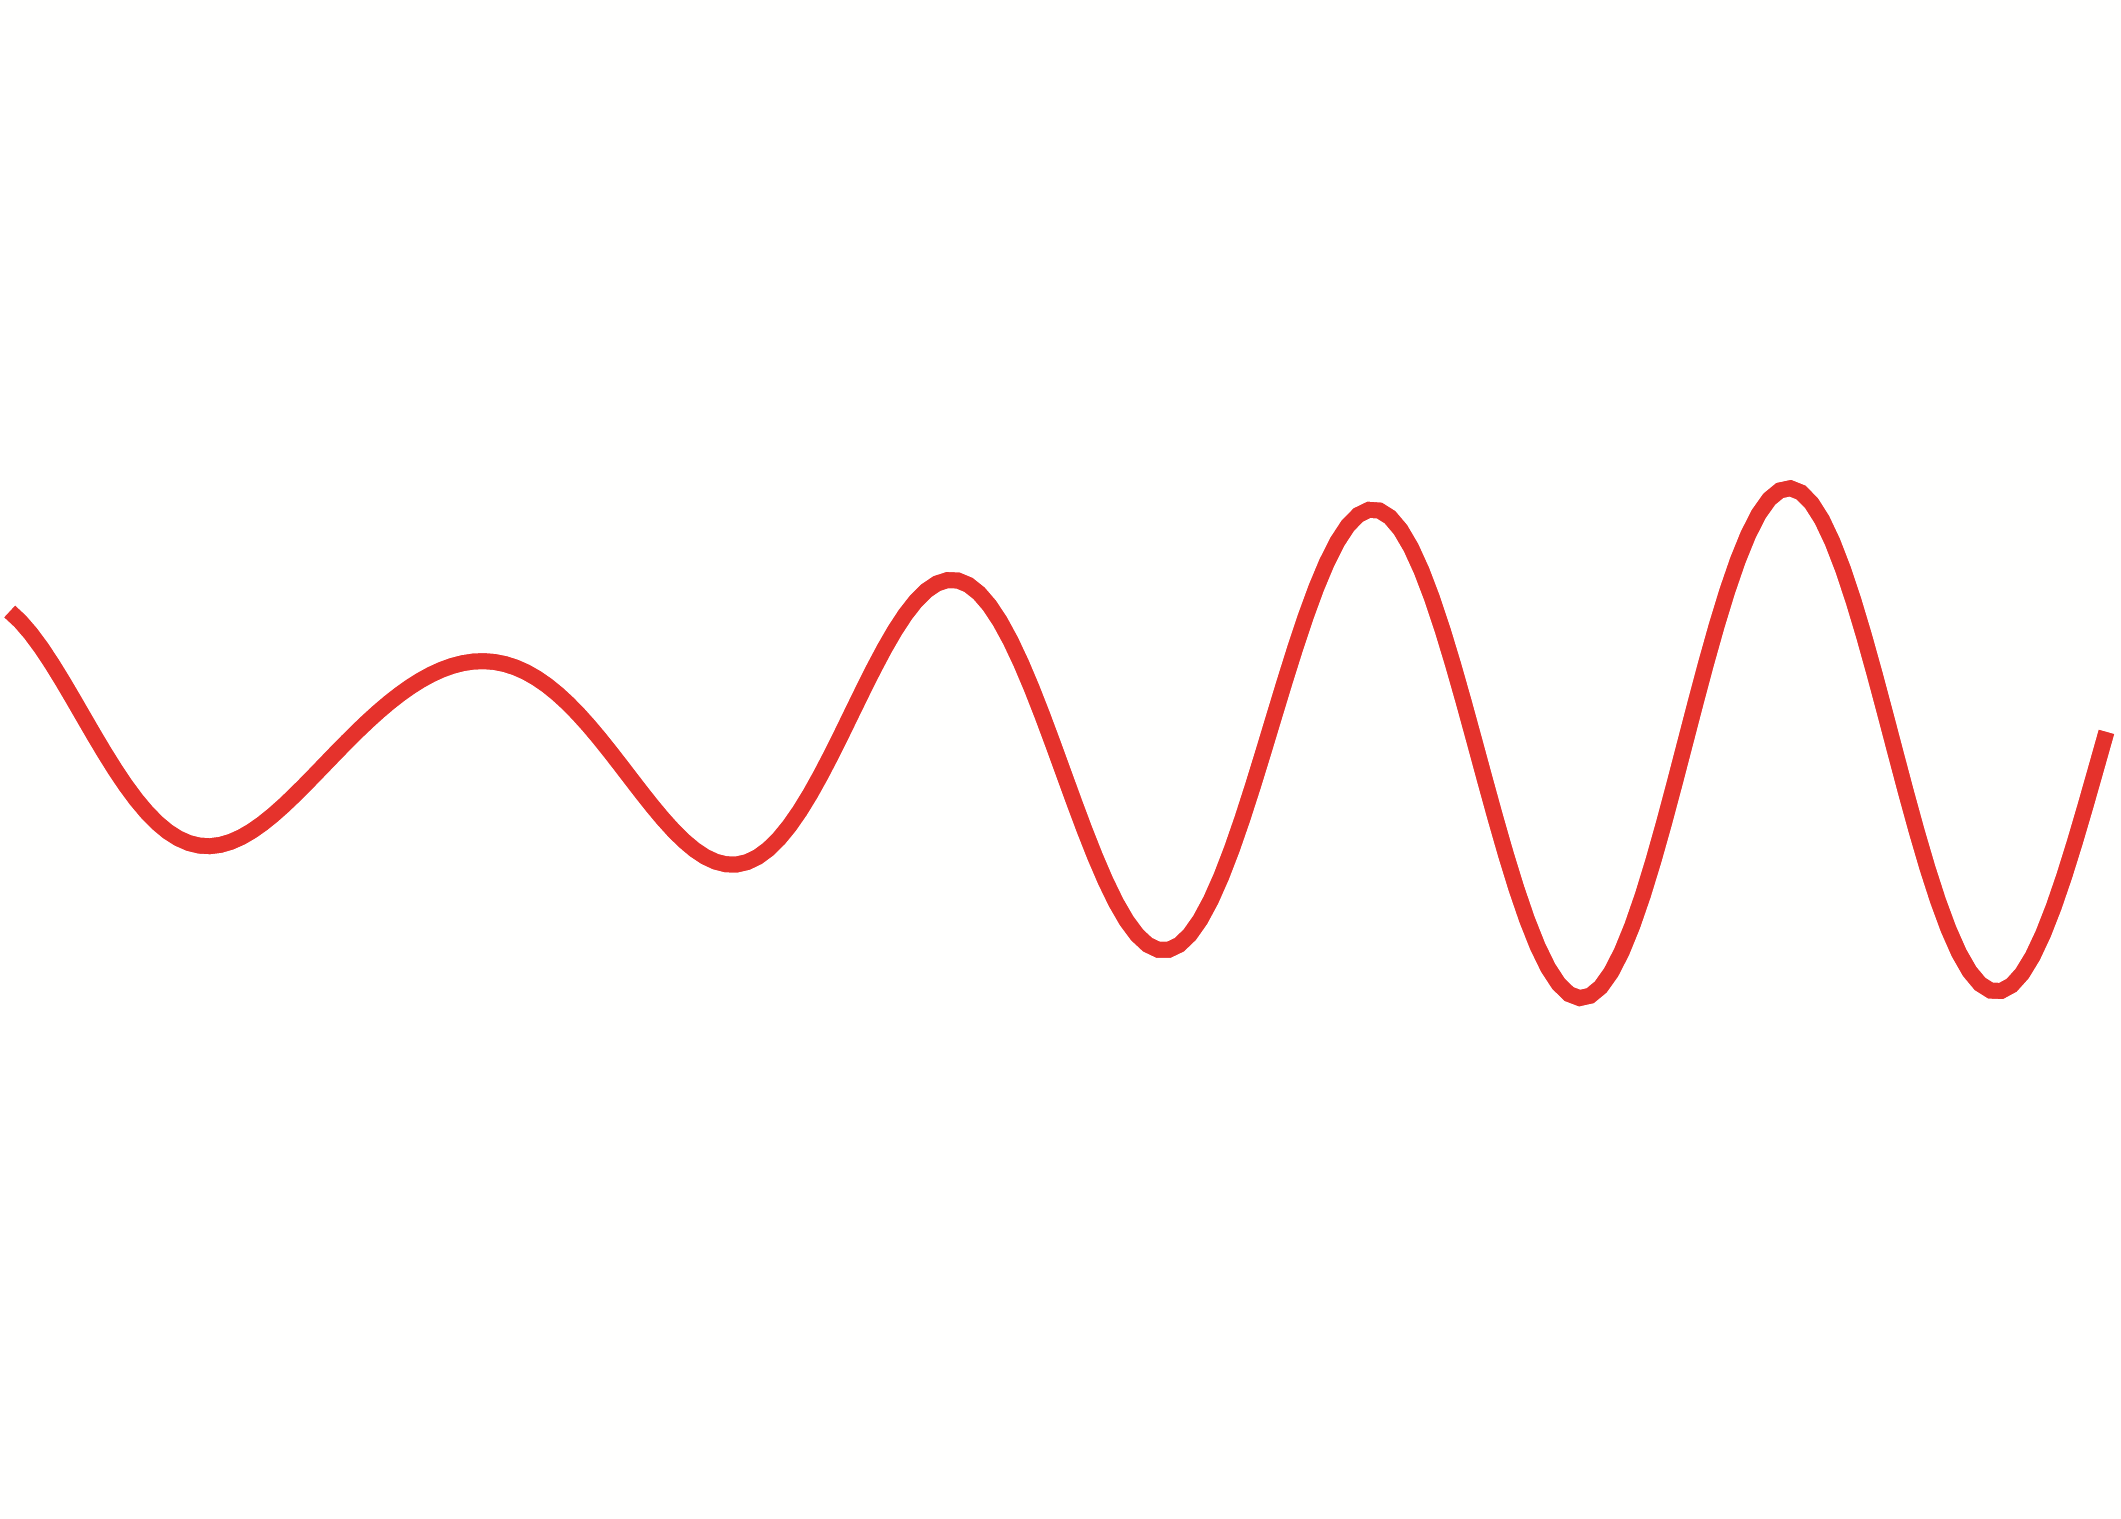
Illustrative representation refers to the implementation of visual abstraction that is extracted from visual analogs and developed to improve the depiction of information. They are the optical abstraction extracted from visual analogue(s).


Artistic representation refers to the experience oriented, creative, integrated expression of the biofeedback data with the intent of making art. The aim of which is to create an aesthetically pleasing experience through its art forms. They are the experience oriented expression of visual metaphor(s).
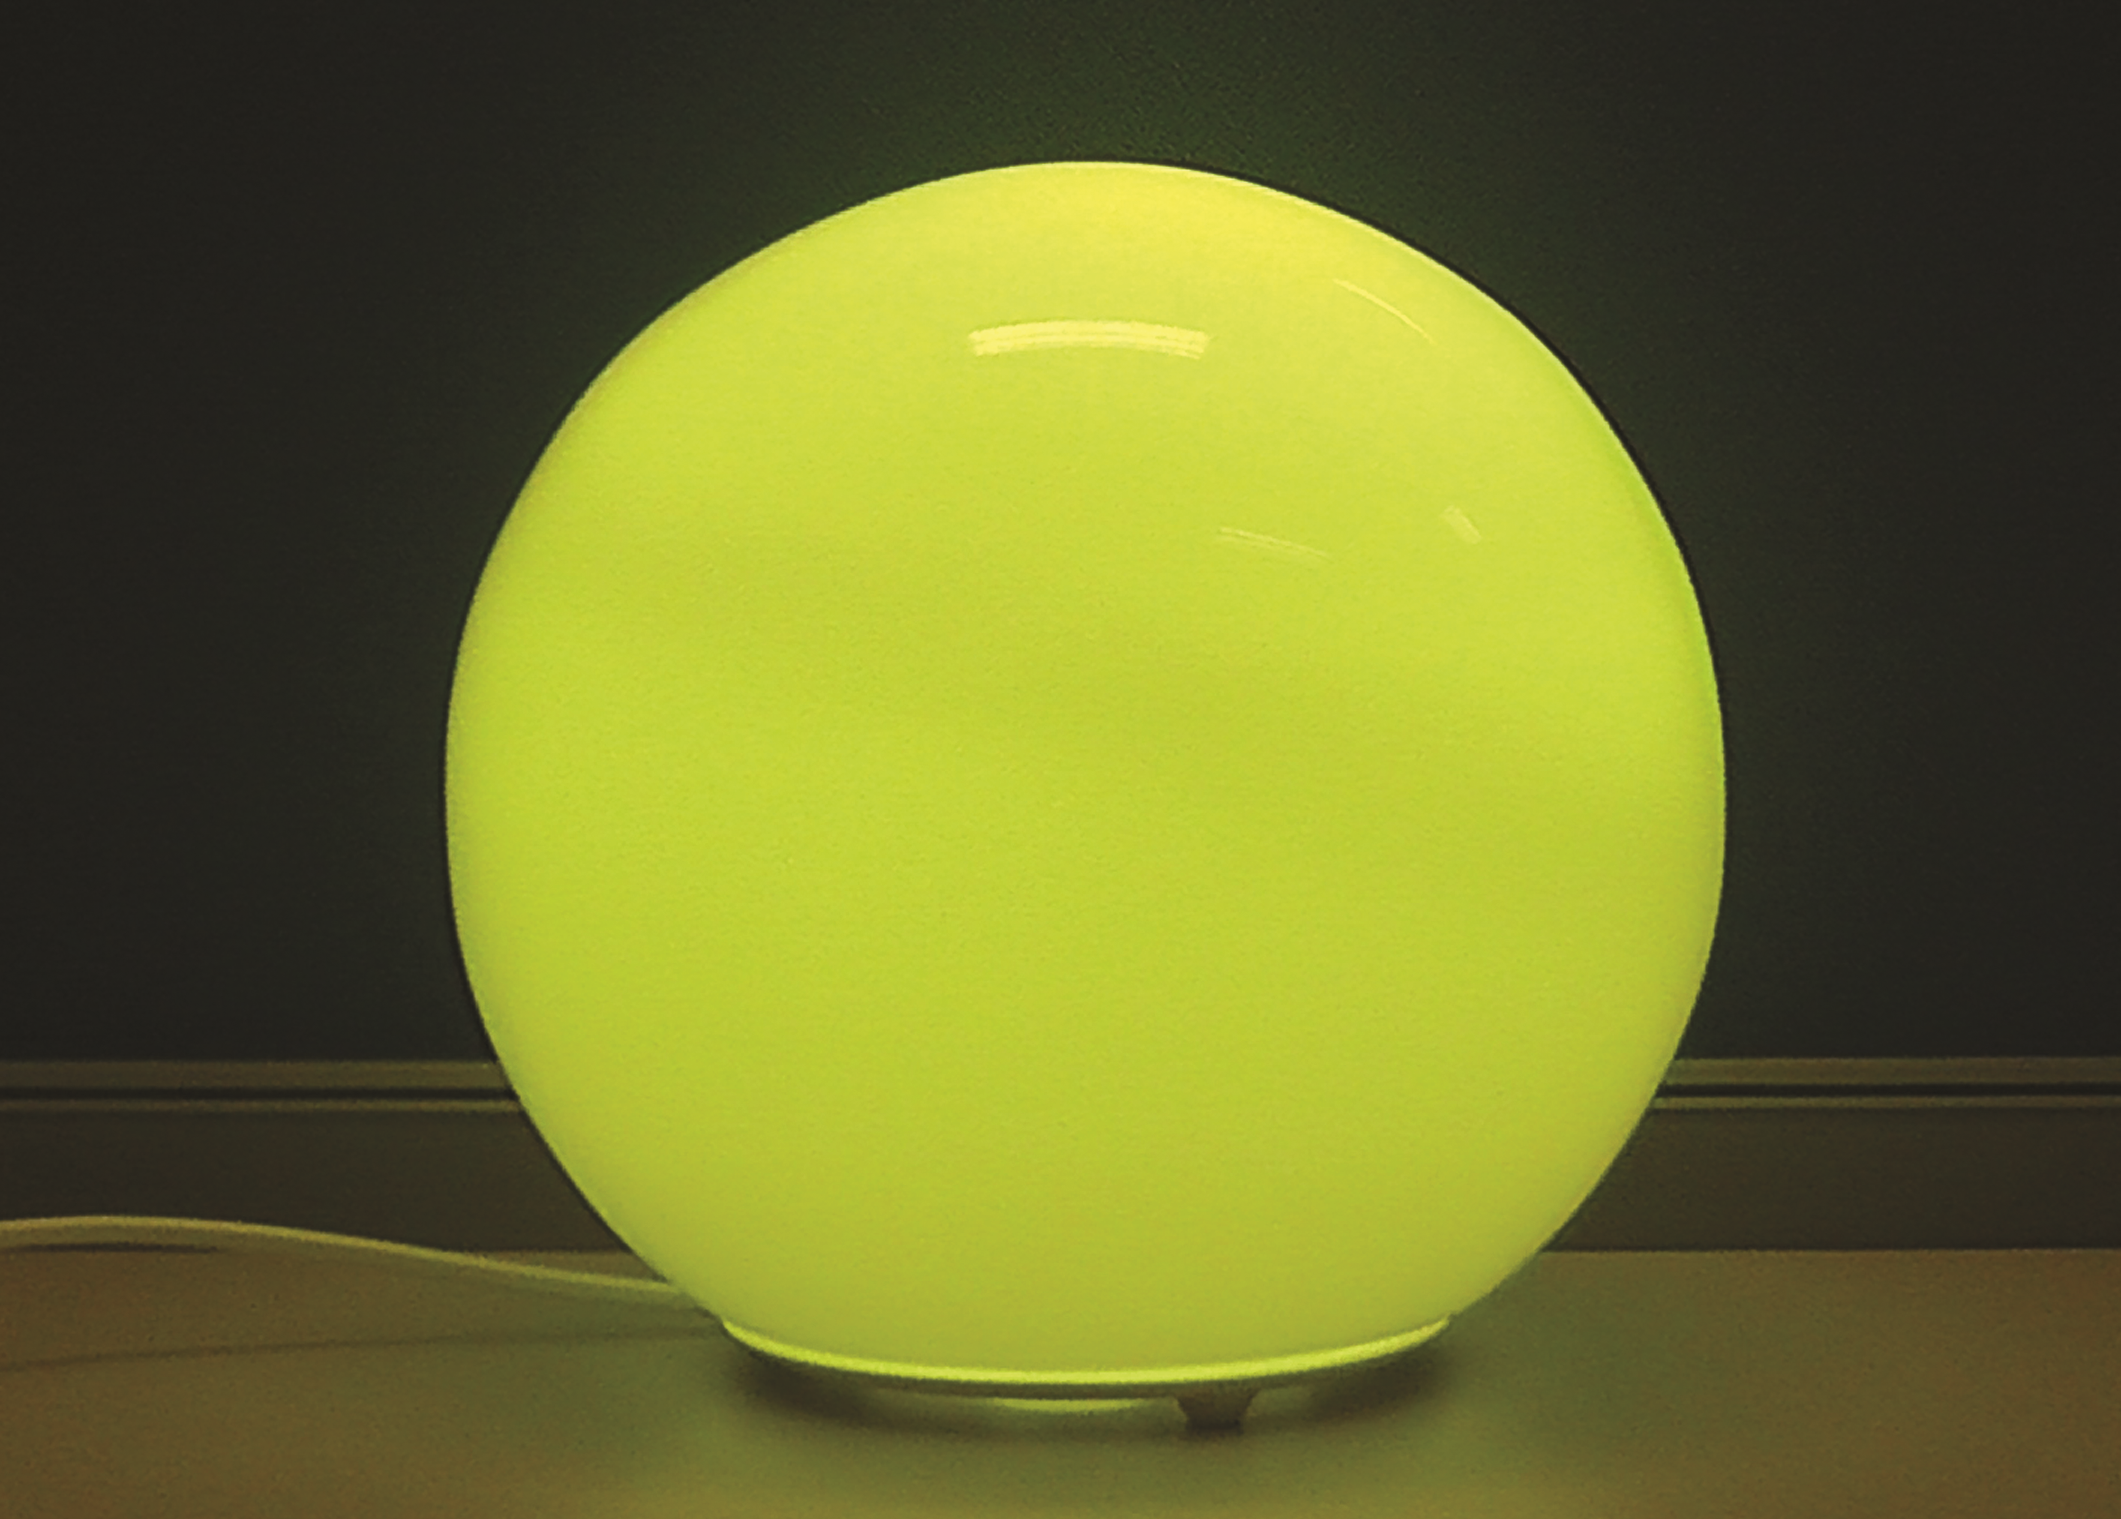
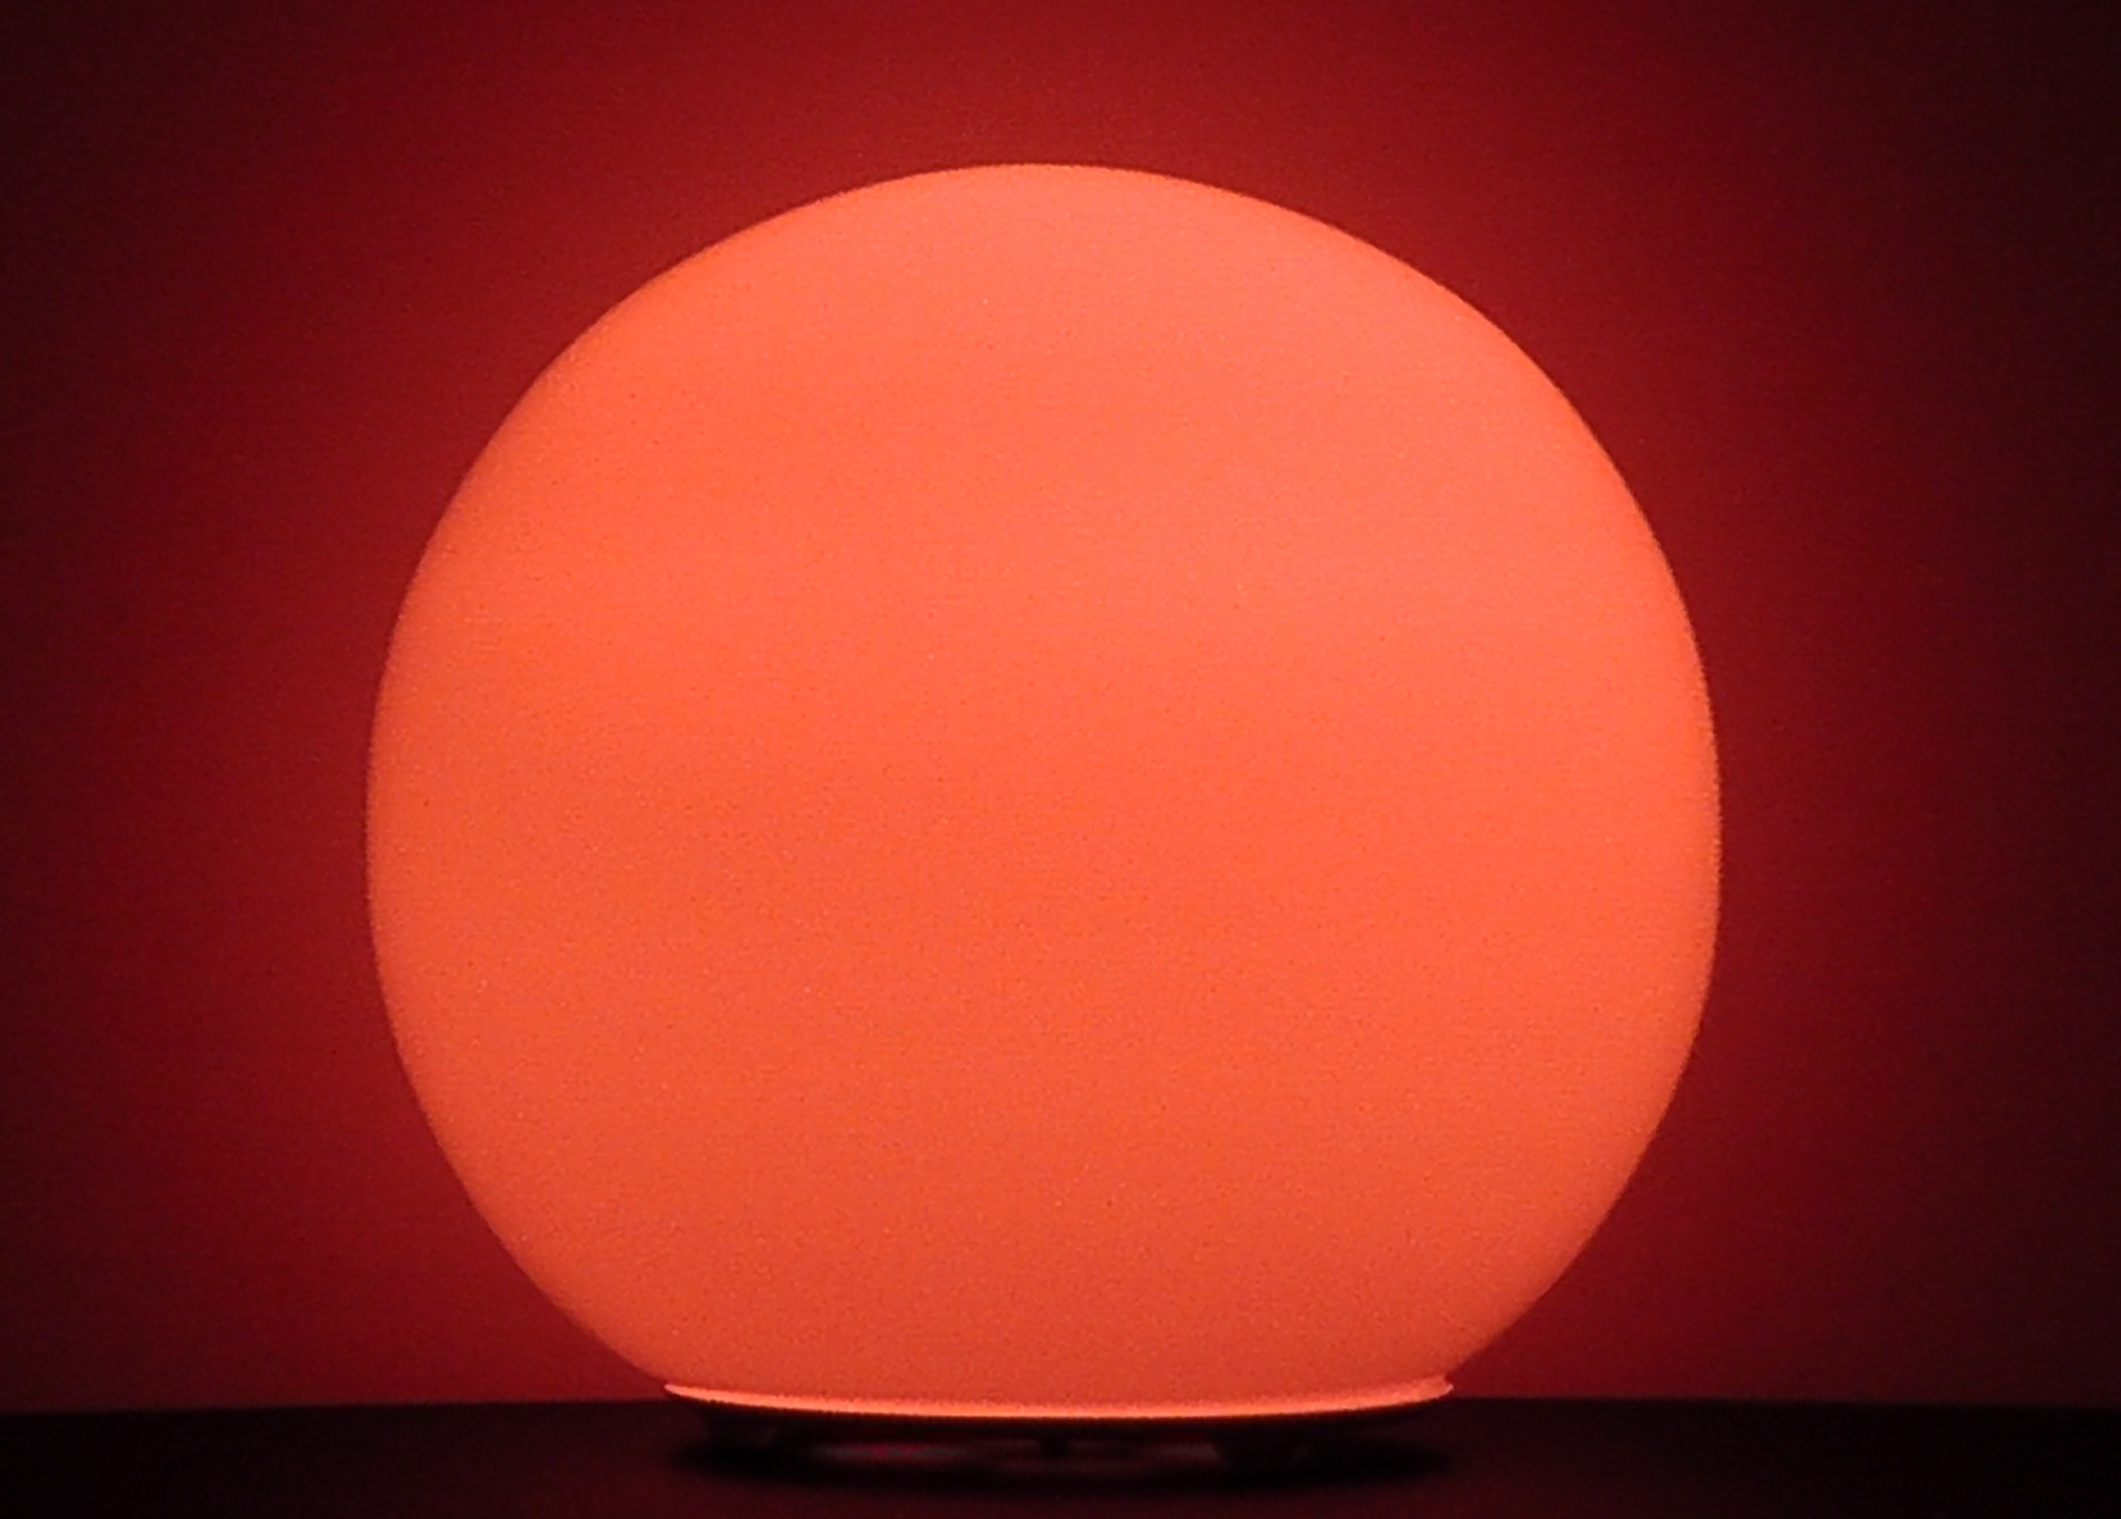
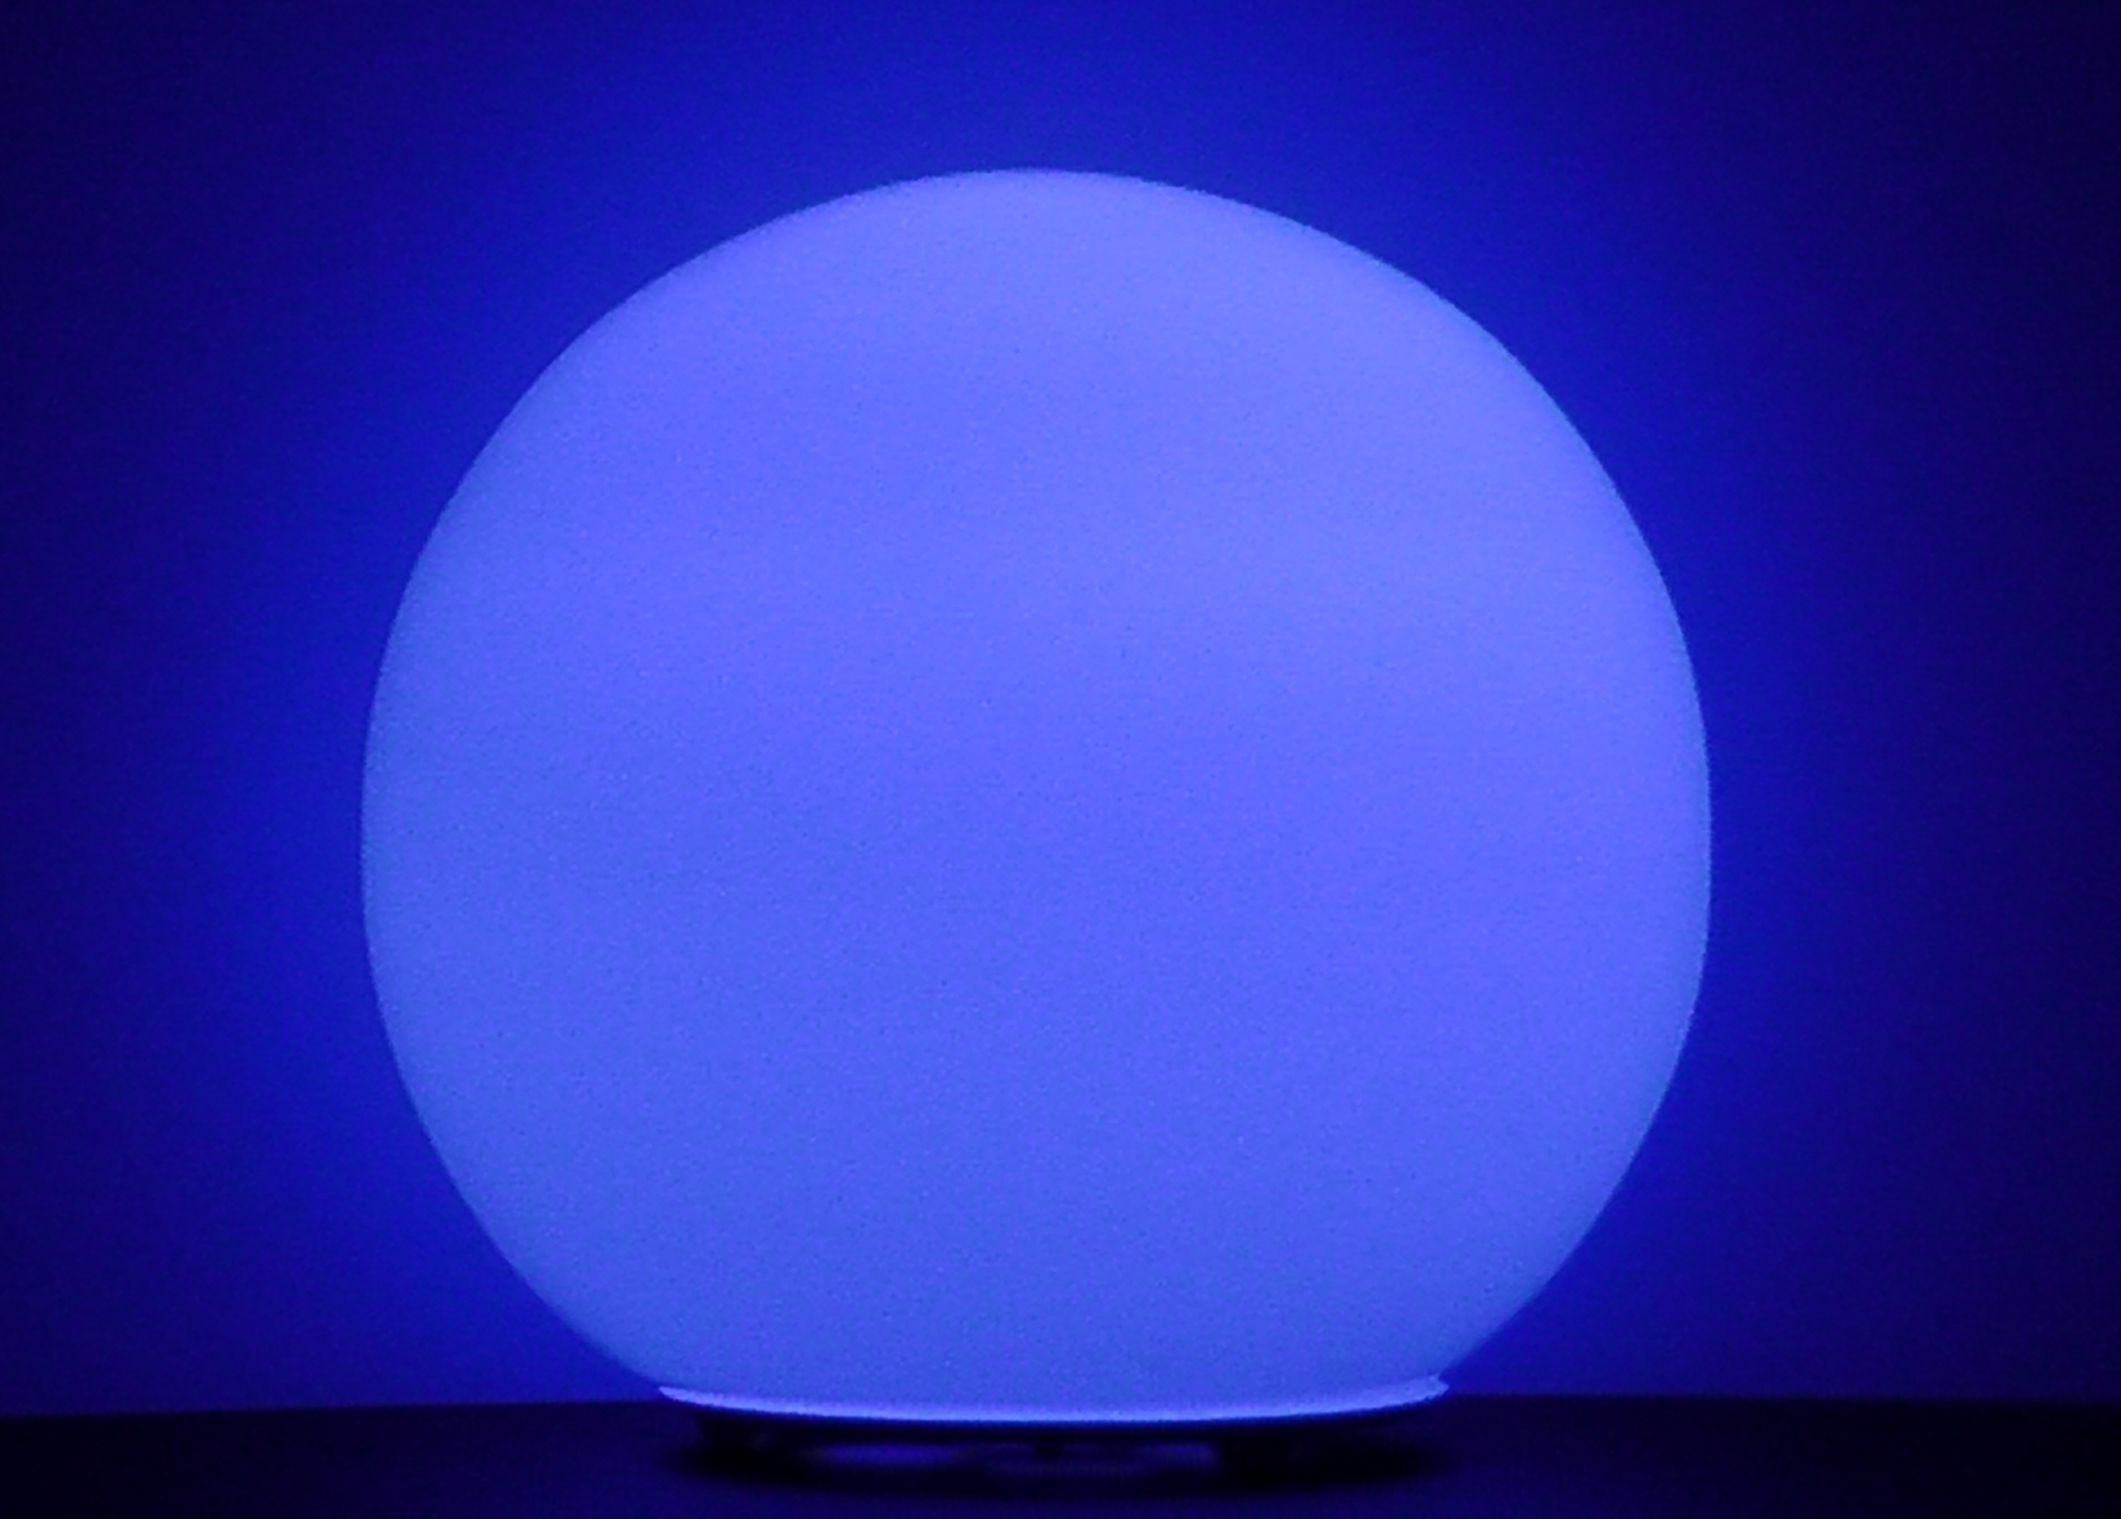
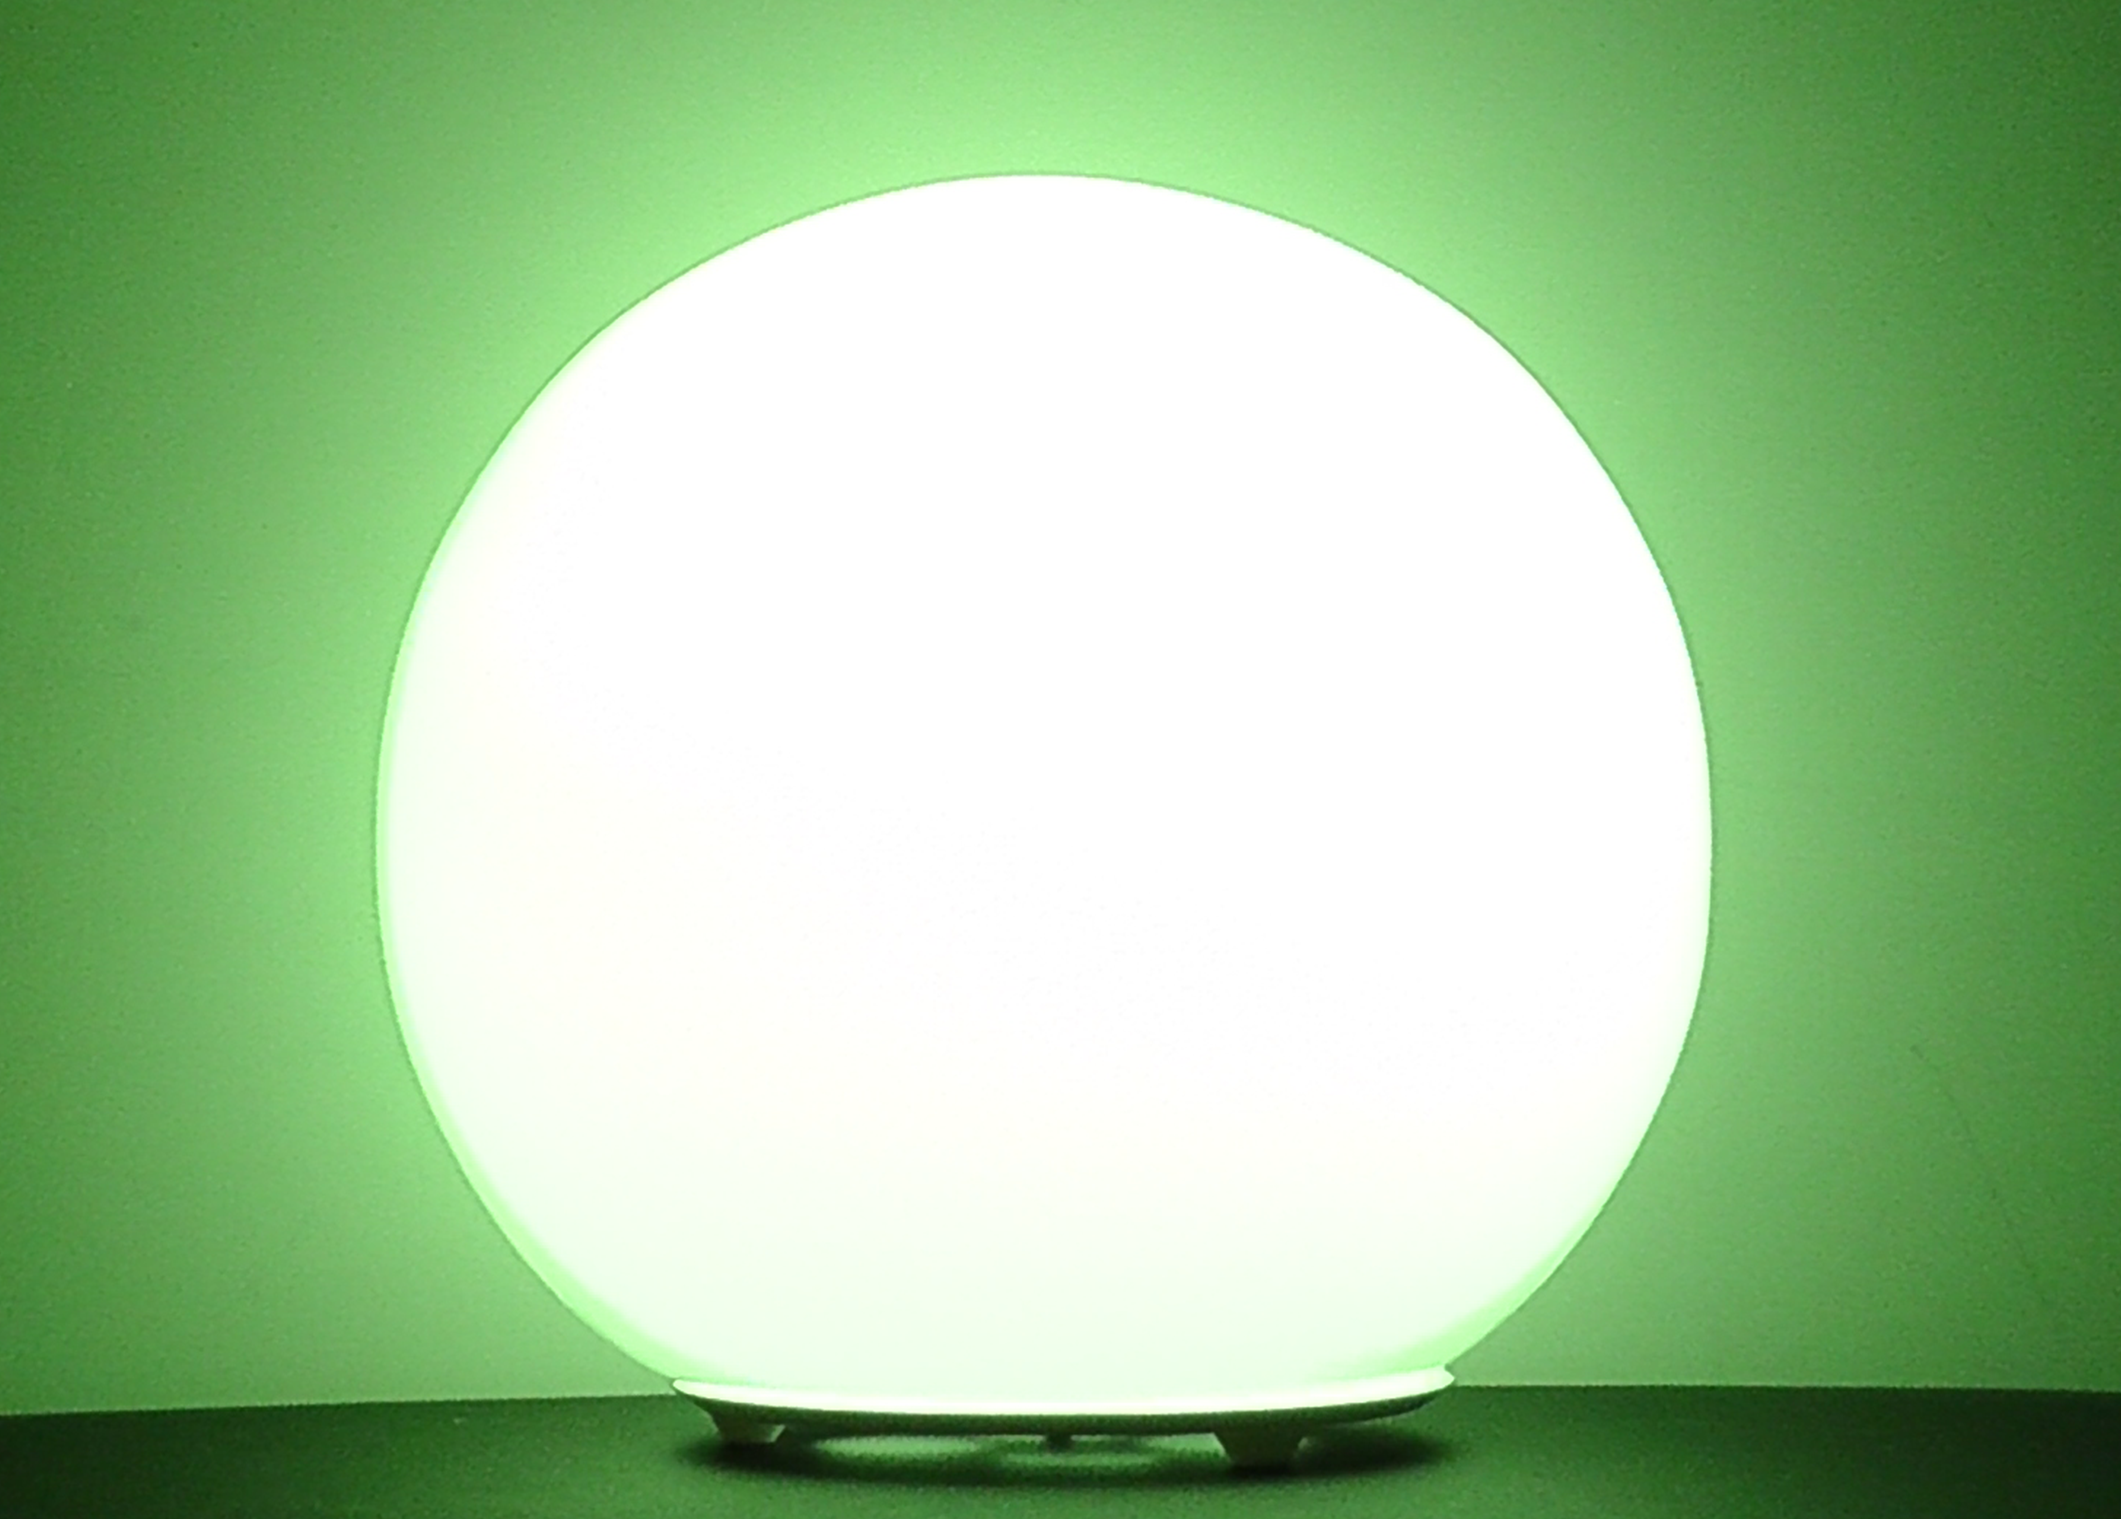
Ambient representation refers to a form of representation that displays the data in a visually appealing way which is attractive and tangible large scale data changes by using everyday objects (meaning “non-screen” in this paper) as the media. They take attractive and tangible everyday object(s) as the media.
Result Analysis
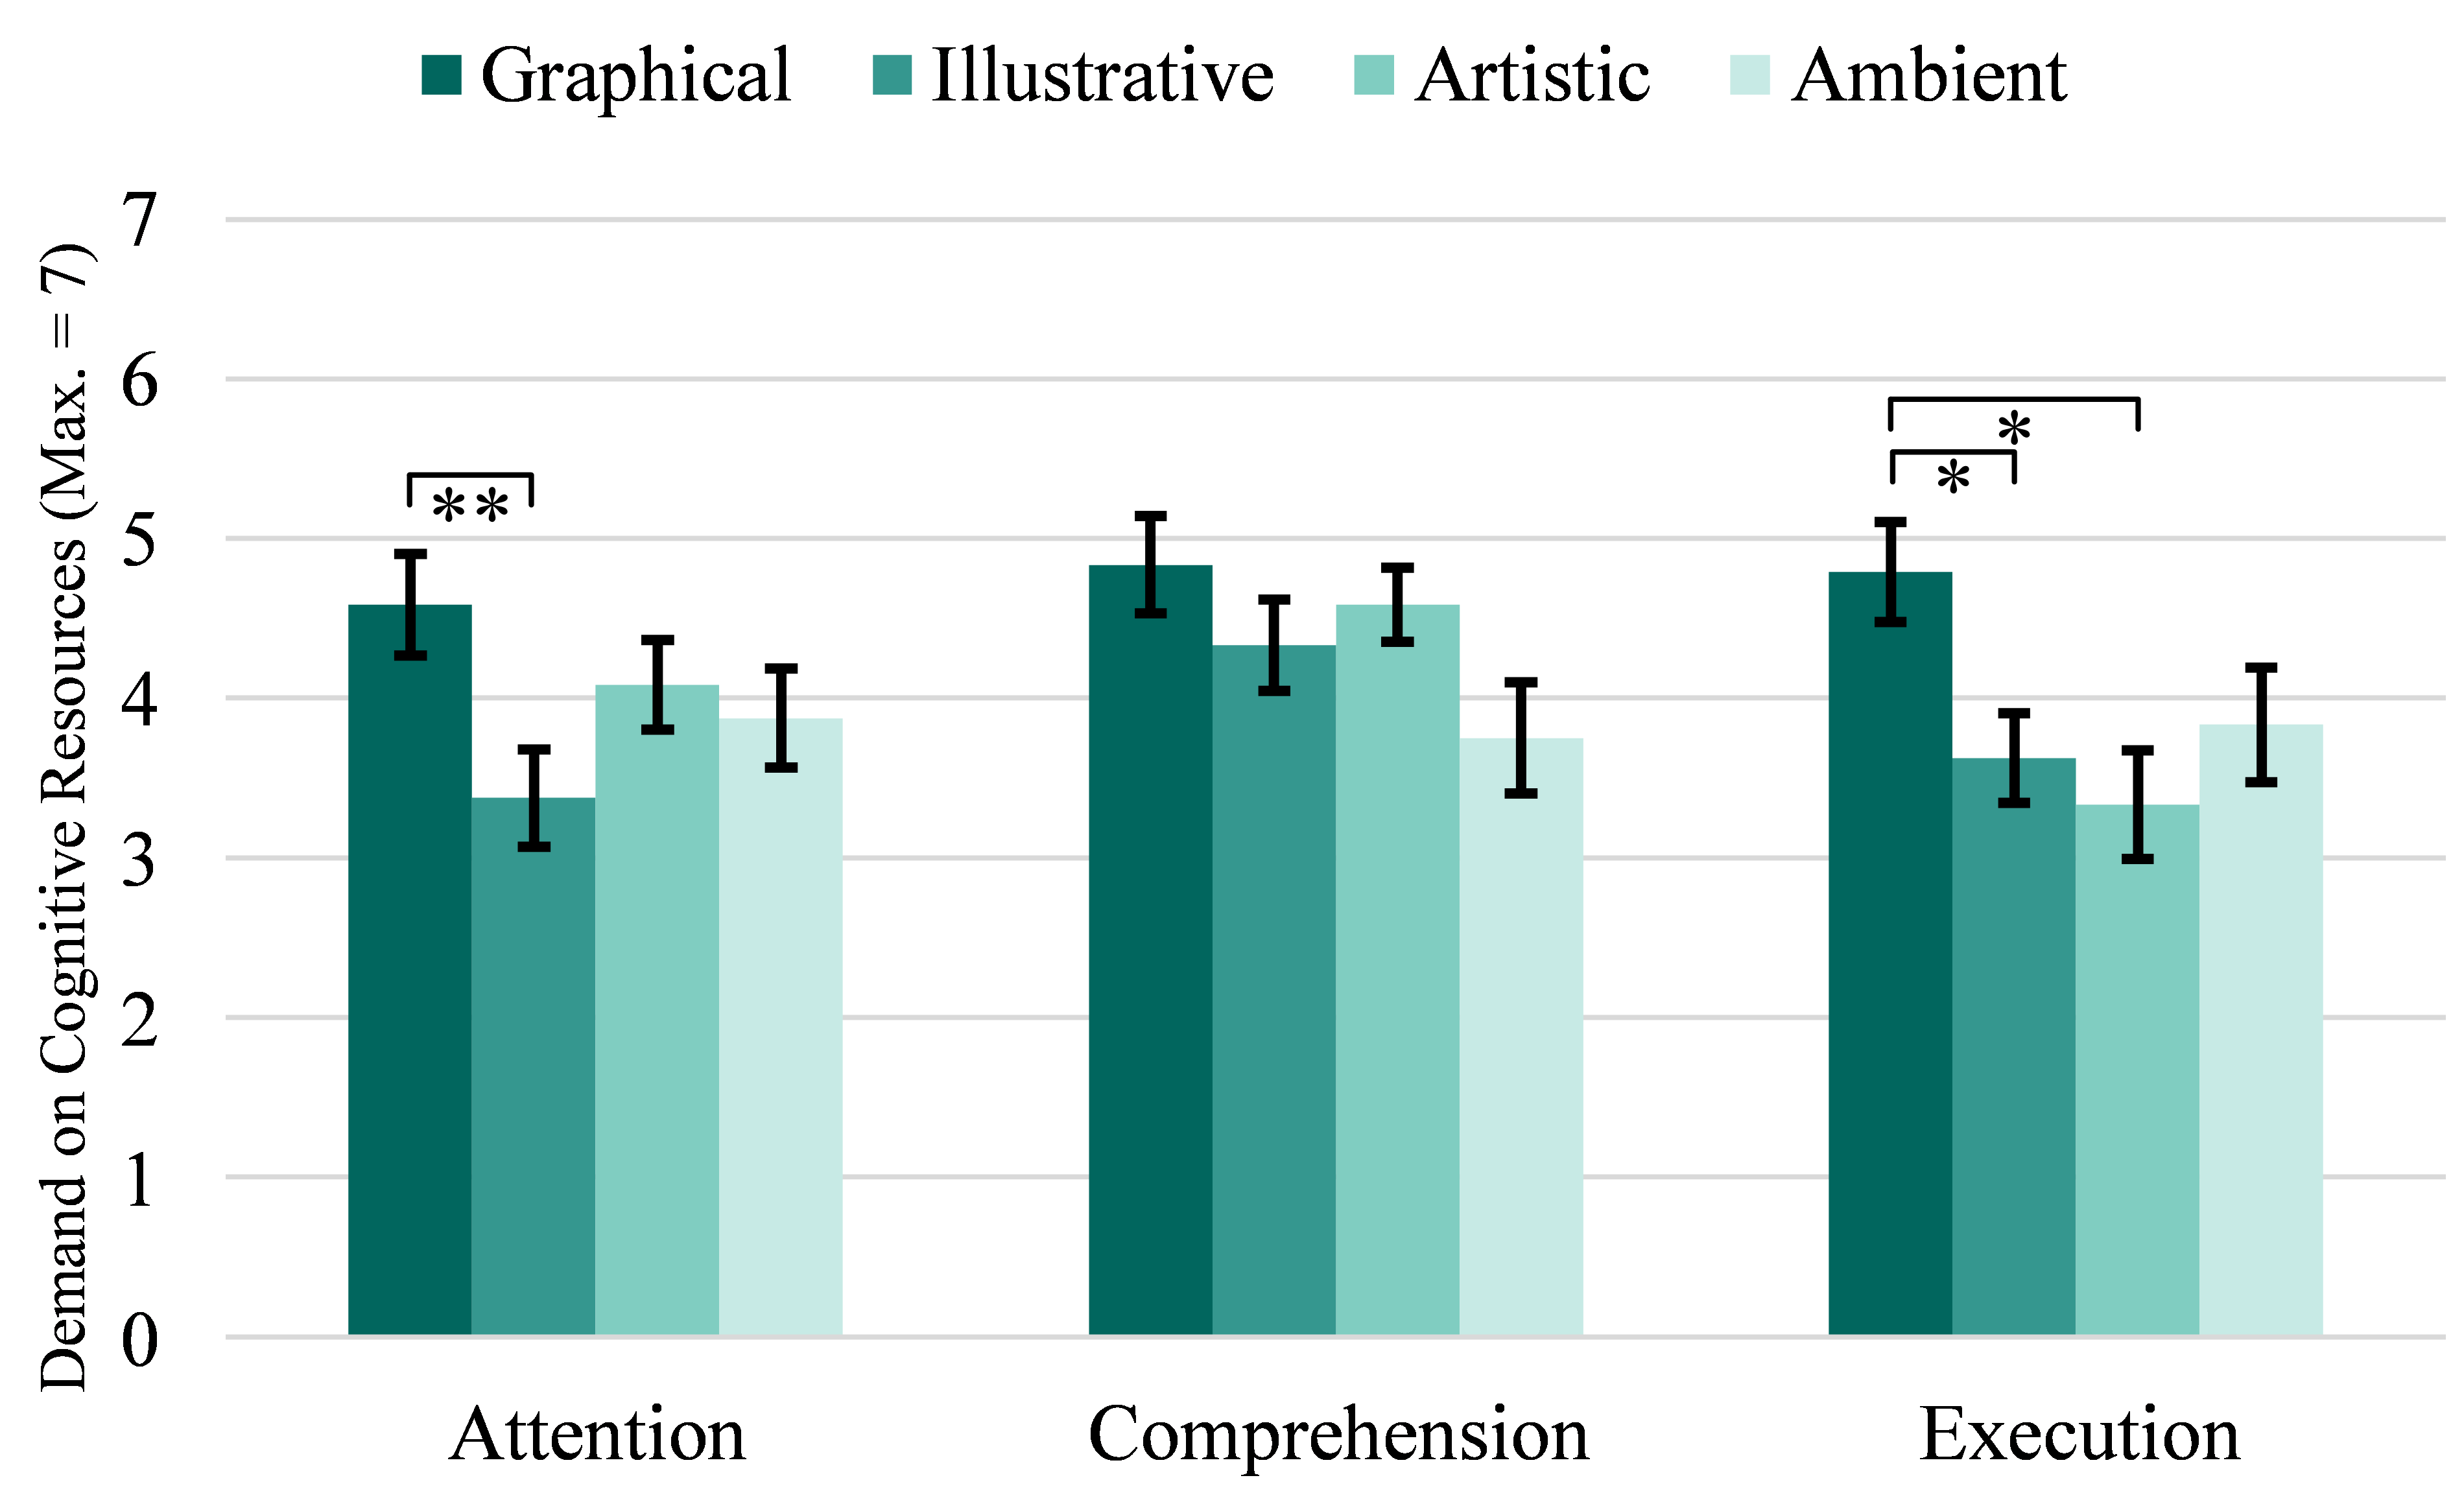
Comparison (with std. error) of the cognitive demand for Attention, Comprehension and Execution for the proposed measurements on given different designs (*: p < 0.05, **: p < 0.01).
Demo Video
This video shows the motivation and how we adopt the proposed four types of representation styles to create new designs for our daily life.
Please try this if the above video is not working.
Zhida Sun, Nan Cao, and Xiaojuan Ma. 2017. Attention, Comprehension, Execution: Effects of Different Designs of Biofeedback Display. In Proceedings of the 2017 CHI Conference Extended Abstracts on Human Factors in Computing Systems (CHI EA '17). ACM, New York, NY, USA, 2132-2139. DOI: https://doi.org/10.1145/3027063.3053082